Reminder: Sabrient is available to chat with Members, comments are found below each post.
DARK HORSE HEDGE – Riding Around in the Breeze
By Scott at Sabrient and Ilene at Phil’s Stock World
Well it's all right, riding around in the breeze
Well it's all right, if you live the life you please
Well it's all right, even if the sun don't shine
Well it's all right, we're going to the end of the line
Traveling Wilburys, End of the Line
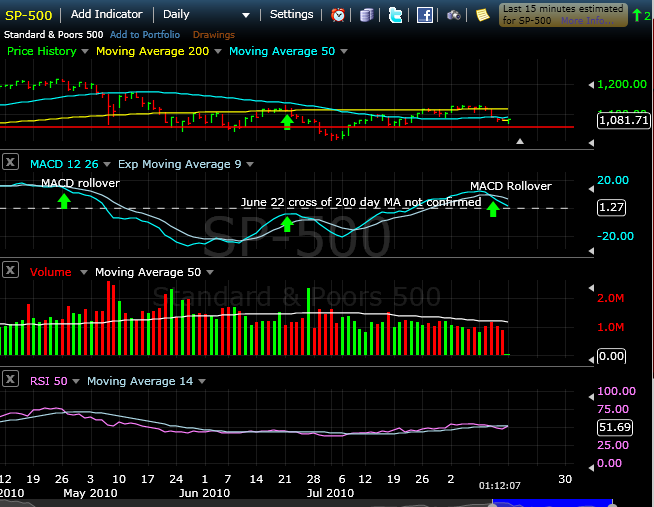
Last Monday, August 9, 2010, the S&P 500 was walking along the top of the 200-day MA in spite of all the negative economic reports coming out. Then on Wednesday, in one trading day, the market changed directions and was suddenly walking just under the 50-day MA, breaking the uptrend that started on July 9. In trying to avoid being whipsawed back and forth in our virtual portfolio balance–which depends on which way our indicators suggest the market is heading–we use a hysteretic method to get confirmation rather than shifting our virtual portfolio balance endless in the wrong direction back and forth. Obviously, following the trend works best when the trend is clear, long and sustainable.
So, we implement the same hysteresis used while the market walks the line on the upside as we do when it walks the line on the downside. We want confirmation of the trend before altering the tilt of our positions–currently balanced. The MACD 12-26-9 that we watch has clearly rolled over but hasn’t yet crossed the signal line. The MACD “rolled over” when darker blue line crossed the lighter blue line–short term EMA, 12 day, crosses long term EMA, 26 day, but it still above the middle EMA (the signal line, 9 day EMA). Because this is a measure of Moving Averages it is inherently a “lagging Indicator” showing shifts in trend, which is why we use it as one of the measures for tilting. We want a lagging indicator to confirm the shift in trend. The RSI 14 day has walked its own line criss-crossing the 50 mark.
For now, we want to replace HUSA (which we will continue watching for another chance to make money after taking +12% on Friday) as a SHORT with Seattle Genetics, Inc. (SGEN).
SHORT Seattle Genetics, SGEN, at the Market Monday, August 16, 2010
SGEN is in a downward spiral with losses mounting and analysts increasing the expected losses. The June 2010 quarter was -$.08 versus a consensus estimate of -$.02 which is just the start of the downturn in business. The nine analysts following SGEN are forecasting a -$.34 September quarter which was increased in the last 7 days from -$.31 and -$.37 for the December quarter, also increased in the last 7 days. Going out to 2011 analysts are predicting a -$1.24 so we believe this is a solid SHORT for the DHH virtual portfolio. Even though SGEN is a biotech and biotechs always have losses while in development stages, in this case, the analysts are seeing problems going forward and are revising losses higher past next year. Even biotechs need to eventually have someone believe they can make money sometime.
DHH is once again BALANCED with 8 LONG/8 SHORT and have 3 LONG positions covered using Phil’s Buy/Write Strategy. We will be monitoring the market this week to determine the need to shift our tilt to the SHORT side if we get continued weakness.
Chart from FreeStockCharts.com


