Courtesy of Jean-Luc Saillard.
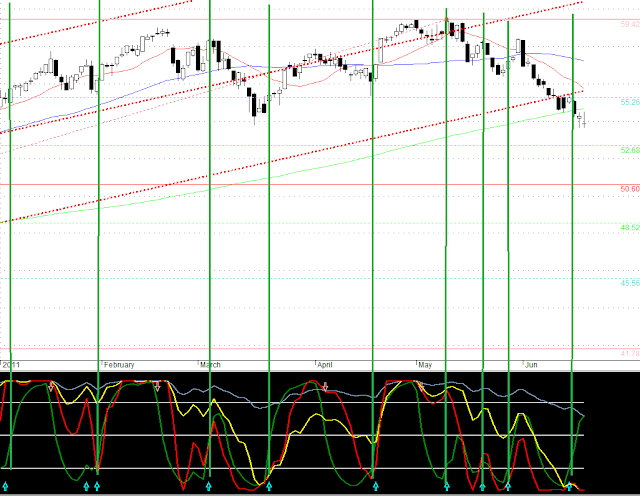
Talk about an ugly chart – look at the QQQ as of Friday!
All the signs point down – the index is below its 15 (small red line), 50 (blue line) and 200 dma (lime green line). In addition, both the 15 and 50 dma are now pointing down. I have a added a regression channel dating from the last lows of last July with width of 1 standard deviation and we broke below that for the first time last week! We closed below the lows for March. The next real support is around 52.68 where there is a fib line that was confirmed by some congestion back in November.
The problem with the QQQ is that there is no real leadership from the big guns – AAPL has been flat to down, CSCO is finding a bottom, INTC and MSFT are going nowhere. NFLX is not going to save the index!
On the lighter side, I have one double-smooth stochastic indicator pointing up as of Wednesday which could indicate a bottom (or temporary consolidation) which it has in the past. But it’s sometimes too early and other indicators are pointing down! But geopolitic issues are weighing on the market now and it’s not something that indicators will predict.


