 Wheeeeeeeeeeee!
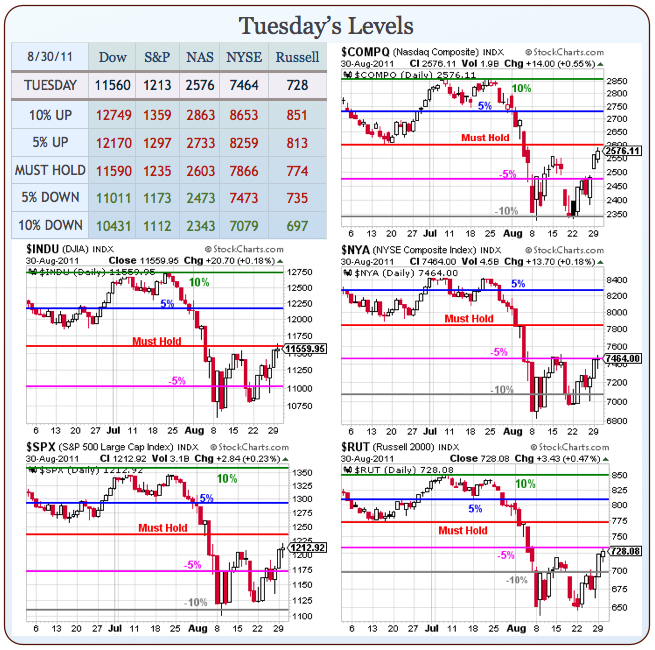
Here we go again. We made it through our "Testy Tuesday" and, as you can see from our Big Chart, we hit our goals with 4 of our 5 indexes coming right up to their resistance lines – not bad for support lines we first drew in April of 2009!
As I often say: I am neither Bullish nor Bearish – just Rangeish. Rangeish has been the winning play for us for quite a while. I was on TV August 2nd, where I laid out our plan for the month (20% drop) and we were VERY HAPPY to do our bottom fishing at those -10% lines for the last few weeks and now we are back in a zone of relative uncertainty where we must hold our Must Hold lines.
On Friday, the 19th, we were confident enough in our bottom call (I led the post off with: "We are now officially getting silly" as the futures tanked that morning) that we shorted EWG puts in the morning post and shorted the VIX at $42.50 with a VXX spread that’s already up 1,433% but well on track to double that.
Also in that morning post (and this is just the free stuff!) I put up a bullish trade idea on XOM at $70 that is obviously doing very well (XOM $74 yesterday) as well as calling for longs on the Futures at Russell (/TF) at 650, Nasdaq (/NQ) at 2,050 and Oil (/CL) at $80. If you didn’t play those bullish, don’t look now because you might cry…
 Once the market opened that day, we added an aggressive play on HPQ in our $25,000 virtual portfolio, buying 20 Sept $26 calls for .60 (now .93, up 55%) and paying for them by selling 5 Sept $23 puts for $1.57 (now .20, up 87%). That trade was net $415 and is currently worth $1,760 – up 324% in two weeks.
We are able to do that when we take advantage of the very high VIX (which we expected to go down) as well as taking specific advantage of HPQ coming off disappointing earnings but it’s not the charts — it can NEVER be the charts that tell you to buy a stock that is plummeting – it’s FUNDAMENTALS!
We also picked up TIE that afternoon and an aggressive upside play on the Russell with a TNA (at $36 that day) Sept $35/39 bull call spread at $2, paying for it with the sale of the Sept $26 puts at $1.60 for net .40 on the $4 spread. TNA is now $49.25 (up 36%) and the spread is $3.60 and the short puts are .15 for net $3.45, which is up 762% – also in two weeks.
That’s a great example of how you can use options to pick up tremendous leverage on index movements although 36% in the index itself is not too shabby…
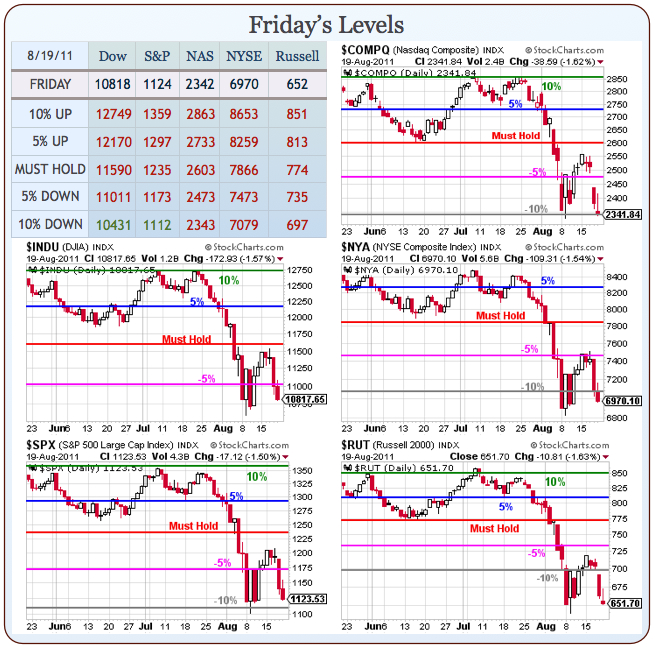
As you can see from the Big Chart of August 19th (above) – there was nothing in the TA telling us to go bullish that day. Indeed we finished at the day’s lows and we were, in fact, expecting to possibly re-test the lows but our FUNDAMENTAL analysis of the data, the newsflow, earnings reports, etc. made us comfortable getting a little bullish that day. This is the pay-off from maintaining a "Cashy and Cautious" stance for most of the month – we were ready, willing AND able to act when the opportunity presented itself.

I say this now because we’re back in the middle of our range and we NEED to realize that our certainty level can not be the same as it was when we were at the bottom of our range. Calling movements at the bottom or tops of ranges is much easier than calling the middle and we need to go back to being cautious (cautiously bullish at the moment because of QE3) as we move through this critical zone. Fundamentals only take you so far – I can tell you that the Dow SHOULD be at 11,590 (our Must Hold level) and if you say – "is 10,500 too low", I can easily say yes and if you say "is 13,000 too high", I can easily say yes but is 11,300 or 11,700 too high or too low? No, that’s silly, it’s close enough and, as I said yesterday – in absence of news or data to the contrary, we can expect a gravitational drift back towards those must hold lines which are, more or less, the "right" price for our indexes at the moment.
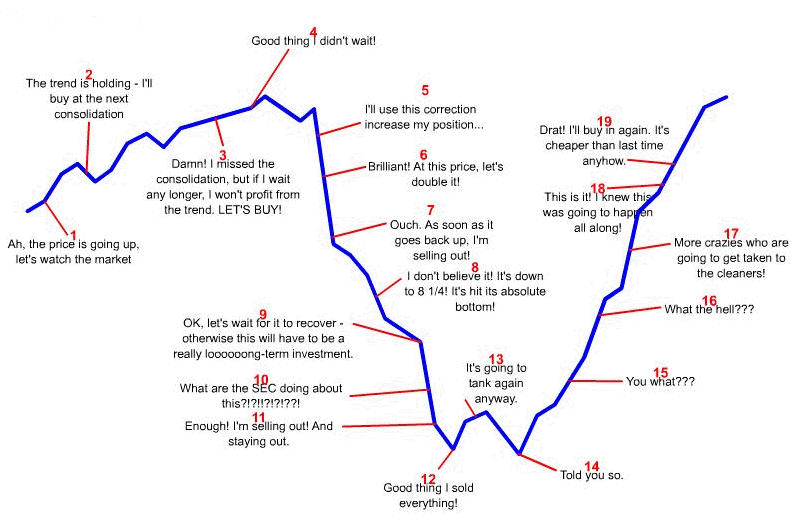
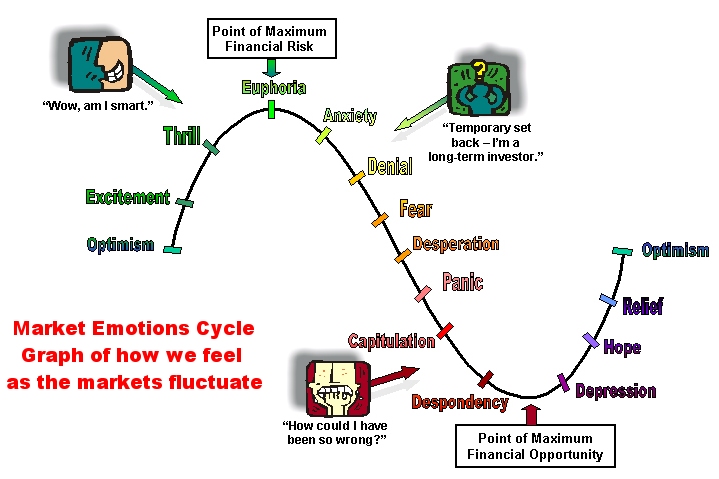
 The above charts on Market Psychology are not just about how YOU feel. While you are very, VERY important, to be sure, roughly $500,000,000,000 worth of stocks and commodities and another $4Tn of Forex are traded every day and they are not all waiting to see how you feel in the morning. While we need to recognize these feelings in ourselves, we also need to try to gauge the mood of the market and that’s why, every morning, we discuss what’s going on in Asia and Europe as well as the USA.
 We have been so focused on Europe and all their troubles recently that we tend to forget how dangerous Asia is looking. Japan is hopelessly mired in debt that is over 200% of their GDP, that means if they were forced to borrow money at 5%, like the PIIGs are, 10% of their GDP would go towards debt service, which would be like the US having to cough up $1.5 TRILLION a year in interest alone! Both China and India have inflation rates that are out of control and all over Asia, companies are being forced to give workers huge wage increases to keep up with inflation – this can cause some dangerous margin squeezes down the road.
Even mighty Canada’s GDP is DECLINING – down 0.1% last Q on falling oil prices. China is keeping Australia afloat for now but a combination of rising input costs and rising wages has sent the Shanghai Composite down 8.6% this year, adding to last year’s 14% drop and, as I mentioned the other day, the PBOC is currently DRAINING liquidity to the tune of 10% of the GDP ($600Bn) to try to reign in food inflation that is causing riots all over the Nation.
 China is still stockpiling copper, with the Government betting on a turnaround, even if investors in China are not. What investors in China are buying is GOLD! According to a report in Yangcheng Evening News last Wednesday, just one city in Guangdong province – Guangzhou – has 2,000 underground investment companies dealing in gold and foreign currencies. Investors can leverage up to 100 times their principal with such black- market brokers, the daily said. The regular market for gold in China sees $1Bn of daily trading volume with another $500M a day traded on black markets. The growth of these black markets is leading to Global instability in the gold market and that’s leading to the exchanges needing to raise margin requirements as it’s the only way they can control the flow from illegal operations.
ALWAYS be aware of who your counterparties are when you are trading. Since the "Arab Spring" revolutions began, we’ve had Billions of dollars pouring into gold markets as nervous despots and their toadies looked for places to park their cash and in Asia it’s the metal of choice for inflation fighers, despite the fact that gold has, historically, been a poor overall hedge against inflation.
I have a simple system for knowing which way to go on gold. Are more commercials on TV asking you to sell them gold or trying to sell you gold? If most of the commercials on CNBC are people who are spending money to tell you what a great investment gold is and that you should be buying it from them – THAT is probably a good time to sell gold. When people are spending their money on TV telling you to melt down all your jewelry and send it to them for cash – THAT is when it is time to buy. This morning, I’ve seen 10 commercials looking to sell me gold and no buyers….
Fundamentally, we could go either way at this point so let’s watch those technicals and, of course – let’s be careful out there!


