 1,320 – That was the S&P close on June 30th.
1,160 – That was the S&P close after yesterday’s wild action. A neat 160-point drop (12%) in 3 months for the World’s largest market kind of sucks, don’t you think? My commentary in June 30th’s "It’s the End of the Quarter as We Know It" post was:
We feel fine because we cashed out on the long side (shorter-term, unhedged positions) and we really don’t care what the market does today or tomorrow but we are betting this rally reverses and we will be taking some (more) short hedges today – hopefully selling into the last legs of this fairly fake-looking rally.
My top downside picks to play the sell-off were EDZ ($17.90 at the time, now $28, which is up 36% even without using options to make a spread) and TZA ($35.50 at the time, now $51.10 – up 44%). As I said in that morning post: "I didn’t think they could take the Dollar below 75 but they hit 74.54 last night and it remains to be seen if they can hold it down in real trading, especially with the Pound weakness (see this morning’s Alert) and the Yen’s unwanted strength. Something’s gotta give and we’re betting it’s this fake, Fake, FAKE rally…."
We were shorting oil futures (/CL) at $95 (now $80, up $15,000 per contract) as we thought the holiday weekend was the end of the run but we did keep heading up to $100 (down $5,000 per contract) before finally getting a drop to $75 (up $25,000 per contract) in early August.
One funny play from that June 30th Member Chat was the VIX Aug $15/17 bull call spread at $1.20, selling the $16 puts for .50 for net .70 on the $2 spread. That just seems so cute (and obvious) with the VIX at 38.84 now (it was 30 at the end of Aug for a full 185% gain on that hedge).
 Other hedges we liked in that post were the TZA Oct $31/42 bull call spread at $3, selling RUT Aug $710 puts for $2.90. The RUT puts expired worthless so net .10 on the spread that is currently $20 in the money for pretty much the full 10,900% gain. EDZ was another October spread we took that day, with the Oct $16/23 bull call spread at $2, selling the Oct $15 puts for $1.20 for net .80. EDZ is at $28.76 and the bull call spread is currently net $5.50 while the puts are down to .25 for net $5.25, up 656%.
In member chat this morning, we looked at our worst performing upside play from our September’s Dozen list and that was X and we took a $1 loss off the $27.50 entry so far thanks to our hedges. Meanwhile, $1.25 (5% insurance) put to work on the EDZ spread would have returned $8.20 and $1.25 put to work on TZA would have returned $136.25 – enough money to buy 6 shares of X with just the insurance pay-off on a single share! This is why IBanks love CDO swaps so much – they can insure one home against default and, using similar leverage, make enough money to pay for 6 homes on the insurance – that’s why banks have done nothing at all to help consumers – they WANT your mortgages to fail – it makes them more money than if you pay them off!
 We don’t WANT our markets to fail but we sure would have been surprised if the markets went up from those ridiculous June highs so we take INSURANCE – just in case – and, of course, as value investors, we do love a good sale! In fact, stocks did go up a bit in early July and people were calling me a perma-bear and saying I didn’t understand the new market dynamics and this time it was different, etc. Now we are down to where I though we should be and I’m being called a perma-bull because I don’t understand the new market dynamics and this time it will be different.
Well, maybe so but, as I said at the end of last quarter – I think I’d like to wait for actual earnings results before I change my mind – which is actually neither a perma-bull nor a perma-bear but just a guy who sees a trading range and thinks we tend to move towards the middle from each end. I know – CRAZY! As I said the other day – is it crazy to buy stocks here when we’re hedged for 20-30% drops on our first round entries or is it crazy NOT to?
 Is the news today really so different than the news of June 30th? Looking at my archives for that week I see:
- Mandarin Monday Meltdown – Ancient Chinese Secret is DEFICITS!
- Winning Wednesday – Markets Make Sense to Charlie Sheen
- Technical Tuesday – Greece in Crisis – Yawwwwwn!
- Monday Madness – Greek Vote Down to the Wire
- Global Financial Collapse Explained in 3 Minutes
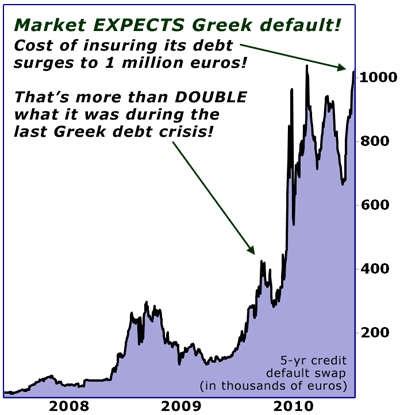
The chart on the left if from the Monday article (6/27) about the Greek vote. We expected a Greek default then and, 90 days later, we STILL expect a Greek default. So, in 90 days, Greece did not miraculously undefault itself and the markets are down 12% BECAUSE PEOPLE ARE IDIOTS.
Sure the markets were too high at the time but they weren’t 12% too high so now they are too low. Just don’t let FEAR drive your investing decisions – much the same way you should not let GREED drive them. Companies, like homes, have REAL, MEASURABLE VALUES and we should buy them when they are low and sell them when they are high – regardless of which way the sheeple are being herded.
 As I have often pointed out this month, the Dollar is up 10% and the market is down 10% but your stocks are priced in Dollars so OF COURSE they are down 10% when the Dollar is stronger. This is one of the funamentals we try to hammer home at PSW because American investors are simply not used to thinking of their currency as something that fluctuates day to day enough to make a difference to their investments. That has not been the case for many years now, as Dollar moves have become one of the main drivers of the market (see David Fry’s chart and, of course, the last year of Stock World Weekly).
Corporate earnings, especially for large-caps, who report early, will be impacted by the strong Dollar. How they are impacted will depend on how they report earnings. If for example, they convert all their Euros into Dollars as they are earned – then their Euro earnings will go down about 5% as it averages out. If, on the other hand, they keep their money in off-shore subsidiaries to avoid taxes and report on their earnings based on today’s conversion rate – then they will be doing so at a rate that is 10% off the top.
So GM sells 1M cars for 20,000 Euros in May and books $29.8Bn in revenues against $27Bn of US production costs and books a 10% profit for Q2. In Q3, GM sells 1M cars for 20,000 Euros and books just $26.8Bn in revenues against the same $27Bn cost and shows a 1% LOSS on the same sales. CATASTROPHE, PANIC – SELL GM!?!??? We used to accept the fact that economies and businesses were cyclical and it was, as recently as the 80s, almost laughable to sell a company over just one bad quarter. Yesterday, there was a RUMOR that RIMM halted production of the Playbook at 11:19, which RIMM categorically denied at 12:31 – but not before their stock was well on the way to down 10% on the day. Too late, the technical damage has been done and, most amazingly – no arrests will be made.
The September New York ISM Business Index is 50.6, up 6% from August’s 47.8 reading, which was impacted by Hurricane Irene. At the same time, OUTLOOK has fallen to 55.9 from 63.2 in July (11.5%). Had we gone by the July Outlook, we would have been bullish at the top of a 12% drop. So, do we get bearish now or do we realize that the "Outlook" is a lagging sentiment indicator more than an accurate predictor of future conditions?

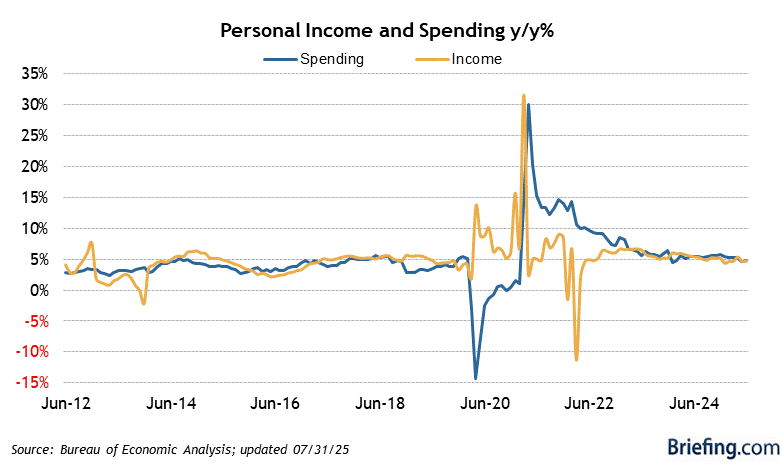
August Personal Income and Outlays showed Income falling 0.1% (fun for the "job creators") while Personal Spending rose 0.2%. PCE core prices were up 0.1% and that all led to a 0.3% DECREASE in Real Disposable Income for the US Consumers. Wages and Salary Disbursements were slashed across the board but they were offset quite nicely with Proprietor’s Income increasing at a 109% faster rate than July (the rich get much, MUCH richer) and Rental Incomes were up $8.3Bn. So if you own property or employ people – it was a good month. If not – then not so much…
 In fact, Personal Savings dropped $31.2Bn in July in order to fund that increased spending against falling wages. In Member Chat this morning, JCaesar asked how Consumers can be "deleveraging" when income is falling and the answer is – DEFAULTS! Every time a consumer defaults on a $300,000 home loan, consumer debt goes down $300K, when an American citizen goes bankrupt (close to 2M at this year’s pace), they owe an average of $36,000 – that’s $72Bn of deleveraging right there!
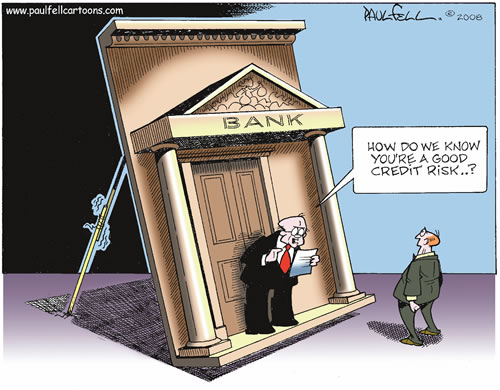
Why do people go bankrupt over "just" $36,000 – because the average family income of a person who goes bankrupt is $24,000. Just as it is with Sovereign Nations – when your debt gets to 150% of your GDP – you’re NOT going to end up paying it off!
Hopefully they manage a stick into today’s close that keeps our losses for the quarter under 10% but the fear is running hot this morning and anything can happen so let’s be careful out there.
Have a great weekend,
– Phil


