Courtesy of Jean-Luc Saillard.
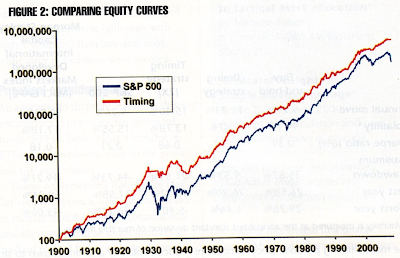
A while back wrote a post about a method for timing the market that I read in an old article of Active Trader (Mebane Faber – April 2009). The author claimed that using a simple moving average on a monthly chart would yield better returns over time and reduce drawdowns. The strategy between 1900 and 2008 returned 10.45% a year versus 9.21% with no timing but the big difference is the 50.31% drawdown as opposed to 83.66% without timing!
Here are some illustrations of the equity curves comparison:
Keep in mind that the vertical axis is a log scale – the difference today is between $1 million for the non-timing system and $5 million with timing!
The next graphic shows the same comparison since 1972, but also adds a curve for a margin portfolio with 2x leverage (non-IRA for example)
Once again, the vertical axis is a log scale. Clearly, the Internet bubble years between 1996 and 2001 were favorable to the non-timing system, but the subsequent crash helped the timing system recover nicely – lower drawdown do help! A leverage portfolio performs much better than its 2x leverage would indicate!
With that in mind, I though that I would refresh my charts to see where we stand. So below is the latest monthly chart with a 10 period SMA as recommended by the author.
We have retraced to the 23.6% line so far, but broken it. The next line which proved temporary resistance (38.2%) stands at around 102 on SPY. I am not making any predictions, but this would be the most logical point of resistance. In 2010, we had a mini-corrections but the 23.6% line held:
That has not been the case this time, so we might need take this more seriously!
In my next post I will outline a timing method used by another market analyst with a good track record! His method also indicates that we should have moved to cash a while back!


