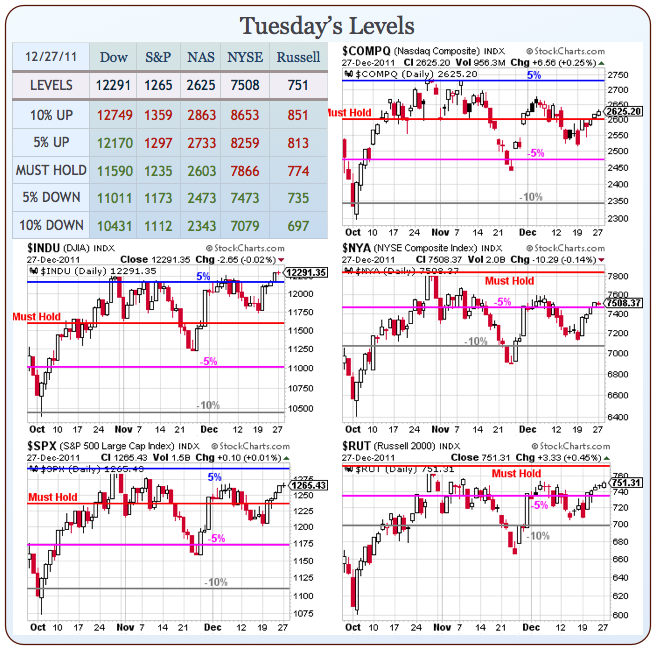
 Watch the Nasdaq.
That's the index we need to catch up to the Dow now that the S&P is halfway to goal at 1,297 (from our Must Hold line at 1,235). The Dow is in La La Land, led by MCD (up 31%), IBM (up 26%), PFE (up 24%), HD (up 20%) and KFT (up 20%) while this year's Dogs of the Dow are BAC (down 59%), AA (down 43%), HPQ (down 39%) and JPM (down 22%).
While the losers may seem to outweigh the winners, that's not how it works as the Dow is price-weighted so BAC dropping from $14 to $5.50 "only" costs the Dow about 68 points (roughly 8 points for each Dollar), IBMs rise from $145 to $185 added a whopping 320 points.
So a 26% rise in one component and a 59% drop in another nets out to a gain of 252 points! At the beginning of the year, they had roughly the same market cap ($150Bn) but IBM has gained $70Bn and BAC has lost $100Bn which, of course, translates into a net gain of 2% on the entire Dow – BECAUSE IT IS THE STUPIDEST INDEX ON EARTH!
Our Members, of course, know this. I wrote "DJIA: The Most Useless, Overused Tool on the Planet" back in 2006, when GM was still part of the Dow so no need to rehash it all here other than to mention the fact that a 30-component index has made 5 substitutions in the 5 years since I wrote that article only serve to highlight how ridiculous it is to use the Dow to draw long-term conclusions. The Dow is manipulated because it's easy to and Uncle Rupert sits with the other Masters of the Universe to decide how to use this headline tool to make things look as good as possible in the US markets.
That's why CSCO and TRV replaced C and GM in June of 2009. C was at $28.80 and is down a bit, GM went BK from $45 (which would have been a 360-point loss in the Dow) while CSCO was disappointing but essentially flat and TRV is up $20, adding another 160 points so a 520-point swing (5%) on those substitutions alone. In September of 2008, AIG ($135 at the time) was swapped for KFT ($32). KFT is just $37.70 but AIG was another BK avoided by "coincidental" substitution in the Dow – AND THEY ARE NOT EVEN IN SIMILAR SECTORS!
Before that we had the Feb 2008 substitutions of MO and HON for BAC and CVX. CVX worked out but not BAC and again – actual things Americans produce (cancer and electronics) are substituted for things that we consume and leave no lasting value (bank fees and oil). So the Dow's "success" is a measure of America's failure. Anyway, this isn't a post about the Dow – in fact, it's starting to sound a little "Alice's Restaurant" so let's get back to the topic of Charts while we still can:

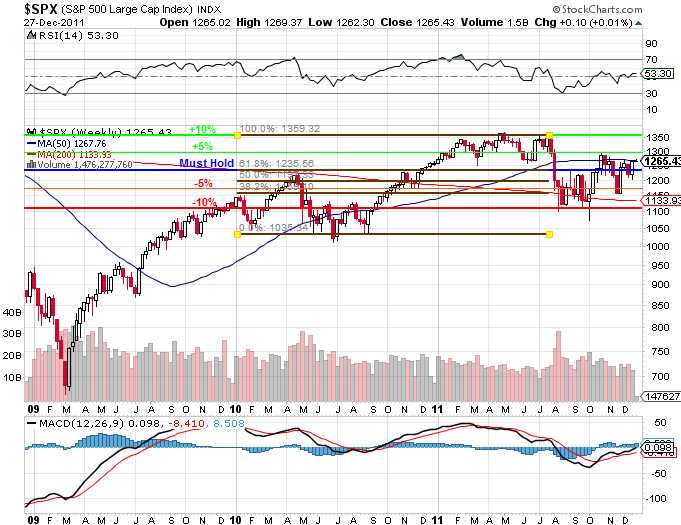
 Above we have the S&P weekly chart, annotated with our 5% Rule Lines that we've been using since March of 2009 to target our expected market range – up and down 10% from our Must Hold line, which is actually 1,236, just off the Fibonacci line (see "Fibonacci Rules – Sometimes, the Old Ways Are the Best!" for more on the Prognosticator of Pisa) but we're nailing 1,359 at the top 1,035 seems to be a sturdy bottom, with only a brief spike below (Greece) last year so not at all bad for 3 year-old predictions, right?
At the moment (see David Fry's chart), we're matching volume and movement pretty closely with the 2009 holidays and that's keeping us Cashy and Cautious into January earnings. We also have the Holiday Weekend and I hate to say it, but on Christmas Day, 2009 passengers jumped a guy on a Delta flight who was trying to detonate a bomb in Detroit and there have been two New Year's Eve plots foiled in the last 5 years so it's simply not a good weekend to be complacent in our positions.
Our primary hedges remain EDZ but now that the Russell is testing the old Must Hold line at 774, we can also go domestic with TZA as well as our old pal SCO and I'll add a couple of hedging ideas for Members in this morning's chat as there are still some really nice bullish offsets we can take advantage of like RIG ($39) and BTU ($33.70). We already have oil an Dow shorts and we nailed the oil Futures in Member chat for the night crew at 2:07 am, where I said:
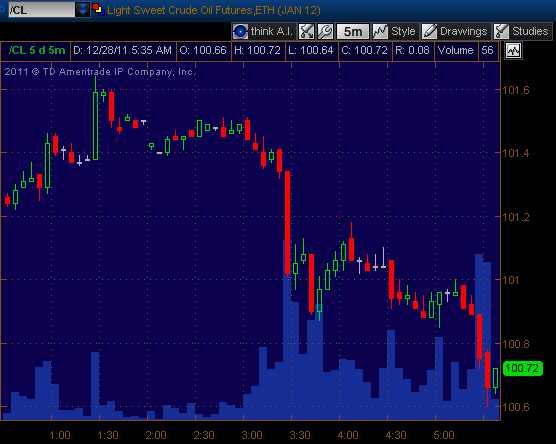
Oil (/CL) at $101.43 – If I wasn’t going to bed, I’d short it with a stop at $101.53. Hopefully we get a drop back to $101.20.

See that top between 2:30 and 3? $101.51 – nailed it! We dumped out at $100.60 at 5:38 (not too much sleep) with a call to re-short at $101 and we hit $101.10 at 7:15 and now back to $100.70. The drop from $101.43 to $100.60 alone was 83 cents at $10 per penny per contract so $830 there and another $300 so far on round 2 is enough money to upgrade to croissants for breakfast this morning!
With that, I'll bow out as I'm off to the slopes. Hopefully the markets don't go downhill as fast we will but I'm still very concerned about Europe, Terrorism, Retail Sales, Oil Prices, China Collapsing, Home Sales, Home Prices, Unemployment, Iran and whether or not Congress can agree on anything in 2012. So forgive me for being a bit bearish as we wait to see which end of our trading range breaks first and it did seem prudent to speculate on the downside into the weekend as we, like the Mayans of old, are just patiently waiting:


