Deconstructing The "Massive Beat" in Employment Data
Courtesy of Lee Adler of the Wall Street Examiner
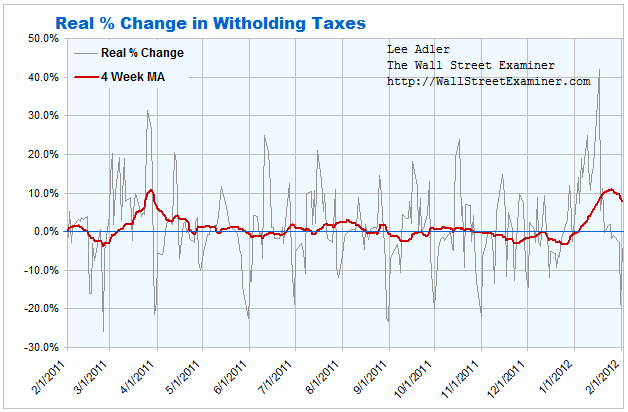
The headlines are blaring of a massive surge in January employment that blew away analysts expectations. Frankly, I find it hard to believe that any analysts would not have expected this "news." The real time Federal Withholding Tax daily data for January, which I dutifully cover each week in the Treasury updates, showed a massive surge beginning in late December. Since everybody didn't get a 10% raise, the analysts might have inferred that more people were working. Whether that's a sustainable trend or not is another question, but for January at least, there should have been no mystery.
I like to look behind the headlines at the real unadjusted, unmassaged, unmanipulated numbers to get some idea of what's really going on. Here's where things get strange. Total reported employment and full time employment plunged in January, as is normal for that month. So the Gummit survey data doesn't square with the tax collections. Had we based our forecast for the headlines (which is the only thing that matters to the market in the short run) on the withholding data, we would have gotten it right, but for the wrong reasons. It's a head scratcher that suggests that the Gummit's employment numbers shouldn't be trusted, which isn't news. What we do know for sure is that there was a gigantic surge in withholding taxes from late December to mid January, and that surge disappeared completely in the last week.

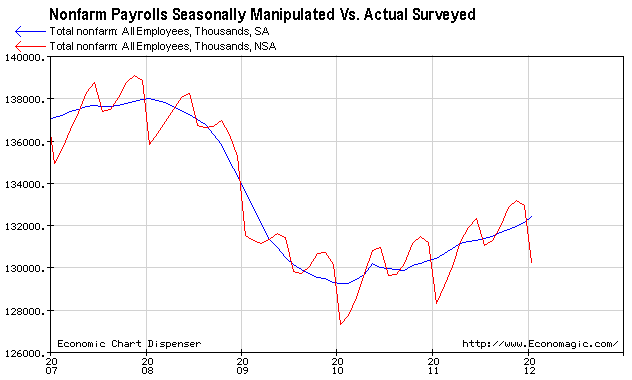
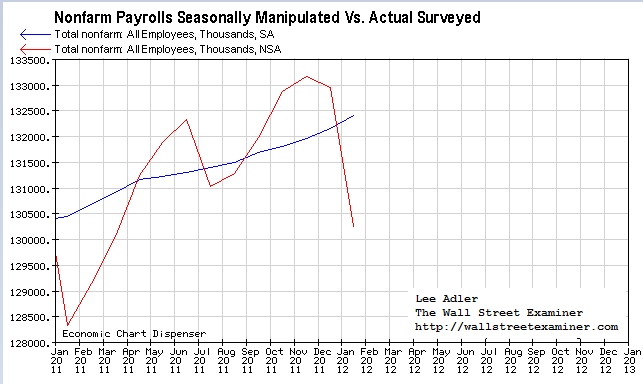
So there's no question that things were fantastic in January, although why and how that happened is a mystery. Last week's action suggests that the good news may not persist in February. We also know that the big beat in the headline numbers was an accident. The seasonal adjustment fudge that the Gummit adds to the mix grossly overstated what the actual survey data showed. Here's a picture. The red line is the actual survey numbers. The blue line is the fake seasonally adjusted number.


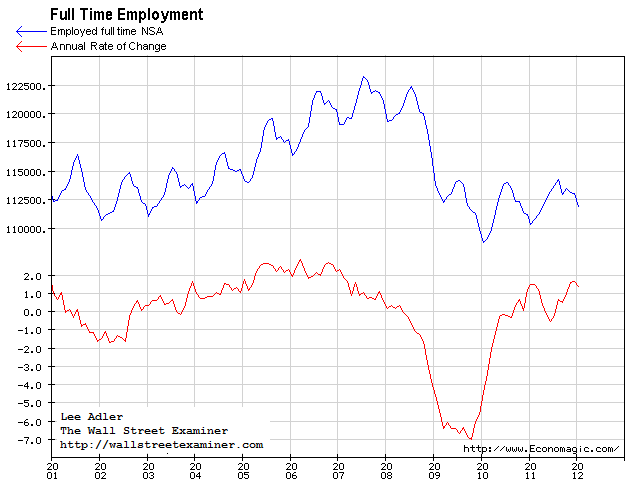
To put this in perspective, the actual survey data says that 111.9 million people had full time jobs in January. That compares with a peak level of 119.3 million in January 2008. They call that a "recovery?"
I wonder whether these numbers can be trusted at all, given the huge surge in withholding taxes in January. From that perspective, the BLS data would seem to understate the gain. But was the gain in taxes really about more jobs, or something else? What was behind that surge in tax collections is a mystery. Apparently, it may have had more to do with bonuses and sales commissions than a big increase in the number of jobs.
There may be a hint of that in the average weekly earnings report which showed a jump of 1.8% between December and January. Apparently some people got big paychecks during the period. I wouldn't attribute it to a sudden increase in inflation, at least not yet.
In the end, it's hard to give any of these reports much credence. The blowout headline numbers are misleading, although the tax withholding data showed that some people clearly enjoyed a windfall from late December through the latter part of January. But then that disappeared last week. The chances are that these employment numbers will be heavily revised, and if last week's tax data is indicative of what's ahead this month, the "good news" won't be sustained.
Given the confusion inherent in these numbers, the proof of whether there's any real improvement in the employment trend may not come until this summer when peak employment levels are normally reached. In 2009, 2010, and 2011, peak full time employment stalled at about the same level each July. This year and last year the seasonal lows have trended upward. So if the economy really is growing, given the running head start off the lows I would expect full time employment to leap past last year's highs in May or June. If that does not happen, then we have gained nothing. The initial indications will come in the rate of growth in February and March. Those are numbers to watch. If the growth rate holds up, then the economy is growing, but if those growth rates slow, then we're probably running in quicksand.
Meanwhile, the government's own survey data show that 7.4 million fewer people have full time jobs today than was the case 4 years ago. Those 7 million jobs were the fake jobs spawned by the housing and credit bubbles. Those jobs were vaporized when the bubble economy collapsed. They are NEVER coming back. The "new normal" is just the old normal without the added froth. What we are left with is the bitter reality of fewer people carrying the tax load and more people needing government assistance. We have yet to see any real proof that the trends are improving enough to ameliorate those burdens on the economy.
Get regular updates on the US housing market, and stay up to date with the machinations of the Fed, Treasury, Primary Dealers and foreign central banks in the US market, in the Fed Report in the Professional Edition, Money Liquidity, and Real Estate Package. Try it risk free for 30 days. Get the research and analysis you need to understand these critical forces. Click this link to try WSE’s Professional Edition risk free for 30 days!


