Courtesy of ZeroHedge. View original post here.
Submitted by Charles Hugh Smith from Of Two Minds
Our "Let's Pretend" Economy: Let's Pretend "Job Growth Is Best Since 2006"
Instead of just swallowing Ministry of Propaganda swill, let's examine actual data. If we do that, we find job growth is mostly smoke and mirrors.
The Ministry of Propaganda and its media minions are announcing that "job growth is on a tear" and the "best growth since 2006." How about we look under the hood of the employment euphoria? Here is an example of the Ministry's work: Best U.S. employment growth in 12 years Almost all the data agree — labor market’s on a tear.
Over the past six months, the number of people who are employed has risen by 2.3 million — an average of 385,000 per month. That’s the best growth since early 2000, when the dot-com bubble was in full flower.Since August, the unemployment rate has fallen by 0.8 of a percentage points, to 8.3%. For adults over 25, the jobless rate has fallen to 7%.
In other words, people who generally work full time so they don't have to share a bunk in a flop house or live in their parents' basement are almost fully employed, as 'full employment" typically generates an unemployment rate of 5% just due to churn.
Best since 2000. Oh really? Let's look at the data as presented by the St. Louis Federal Reserve (FRED). Let's start with a measure of the workforce, what the Feds politely call the non-institutional population. Note that it rose by 33 million since 2000:

Meanwhile, back in reality, the number of jobs (full-time, part-time, temp, etc.) rose by 4 million since 2000:

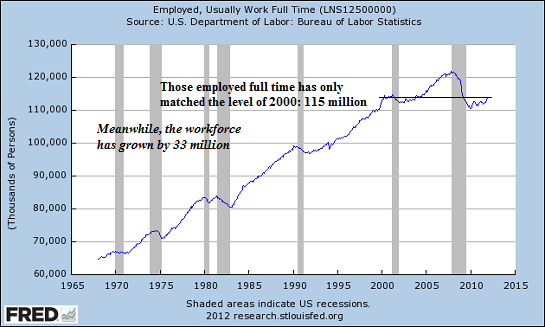
Even more telling is the number of full-time jobs–the kind you can actually live on– which "skyrocketed" back to the number of jobs in 2000, around 115 million. As Zero Hedge reported, the number of part-time jobs (and recall that can mean 2 hours a week or 20 hours a week) has skyrocketed to 28 million. If you haven't tried living on a part-time gig in America, I recommend it for an "on the ground" taste of the "best job growth since 2000." The Part-Time Economy (Redux).

How do you add 33 million people to the workforce while the number of full-time jobs hasn't budged in 12 years and claim "job growth is on a tear"? First you arbitrarily subtract 20 million people from the workforce. Call them "discouraged" or "marginally attached," whatever, just don't call them what they really are which is jobless.

Another way to view reality rather than spin is to look at the civilian-population employment ratio, a measure of what percentage of the populace has a job of some sort: Here we see that it is back to the recessionary levels of the early 1980s. For 64.5% of the populace to have some sort of job as in 2000, we would need an additional 14.5 million jobs. That's about 6 years of 200,000 jobs added a month, but then the workforce will rise by between 12 and 17 million in those years so you better add 400,000 jobs a month if you want the participation rate back to 2000 levels.

If "job growth is on a tear" you'd expect real incomes (adjusted for inflation) to be on a tear, too–but then you'd be wrong, as real income is declining:

According to Conference Board data, those actually seeking work are reporting jobs are hard to get–numbers that are at recessionary levels.

Scroll back through the charts; honestly, is this a "job market on a tear"? Real earnings are falling and the number of jobs you can actually live on remains stuck at 115 million–all the "added jobs" are marginal: marginal hours worked, marginal security (temp), marginal pay (part-time=low pay and no benefits).
Would we as a nation be better off dealing with the truth rather than believing fantasies that prop up the Status Quo and the Fed's dearly beloved measure of the economy, the stock market? How often does accepting illusion help us navigate real life? Short answer: never.


