Courtesy of ZeroHedge. View original post here.
Submitted by Bruce Krasting.
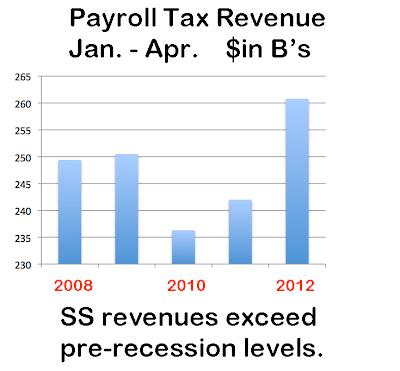
Social Security (SS) has released estimates for both payroll tax revenues and benefits paid for April. The results are adjusted for the 2% payroll tax reduction. (The Treasury pays SS monthly for the shortfall.) The numbers tell an interesting story. Revenues from FICA and SECA taxes are up significantly in the first four months of 2012. A look at the actual income and the percentage change:
.
I’m surprised by the extent of this improvement. These numbers appear to be too good. The Jan. – Apr. results suggest that total employment has now exceeded the levels that prevailed in 2008. But that is not the case based on other information.
According to the BLS data, the number of people who are employed rose from 139.6m to 142.1m from Feb. 2011 – Feb. 2012. The increase of 2.5m workers translates into $5B of additional revenues at SS for the Jan. – Apr. 2012 period. (This assumes average annual income of $50,000) The $19B YoY improvement at SS suggests that there are many more people now working then the reported BLS data. There are some reasons why this discrepancy is so large:
-Annual adjustments to SS’s reported income.
-Quarterly adjustments to SS’s reported income.
-Many workers received bonus payments in Jan. and Feb. 2012. Therefore they have already maxed out their annual SS contributions. (The max = $110,500 of income.)
-SS data covers all workers; BLS data only covers Non Farm workers. It’s possible that more people are finding employment outside of the areas that the BLS covers.
I think that taken together these factors can only account for half of the increase in payroll tax revenue. The other half is a function of more people working. The data suggests there are 1-2 million more people working than the BLS is reporting.
Is this possible? “Yes”, is the answer. The BLS puts the work force at 142m. Could its numbers be wrong by 1%? Sure they could. The BLS conducts its surveys by land-line phone. It does not attempt to contact households that exclusively use cell phones. In 2010, 27% of all households exclusively used cell phones. The exclusion of a quarter of all households makes the BLS numbers very suspect.
Note: The observation that there may be 1-2 million more people working (including part time) runs counter to other information that I look at, so I’m a bit confused by the result. The data can be found here. I’d be interested in any alternative theories as to why the numbers appear so strong.
..
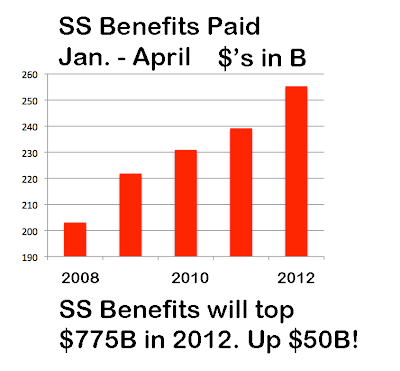
The double whammy of inflation and 10,000 new people a day getting SS checks is causing costs to soar at SS. The payout has been averaging $4B a month higher than a year ago:
.
.
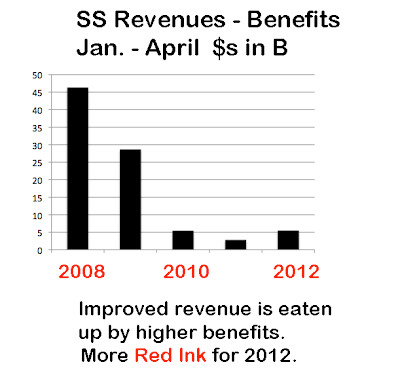
A basic metric for measuring SS is payroll tax income minus benefit payments. This chart looks at the results for the Jan. – Apr. periods:
.
.
The first four months of the year is a period of high seasonal tax income for SS. Most of the months for the rest of the year will end with cash flow shortages. Based on Jan. – Apr. results for 2012, I forecast a full year cash deficit of $40B (vs. $45.5B of red ink in 2011.)


