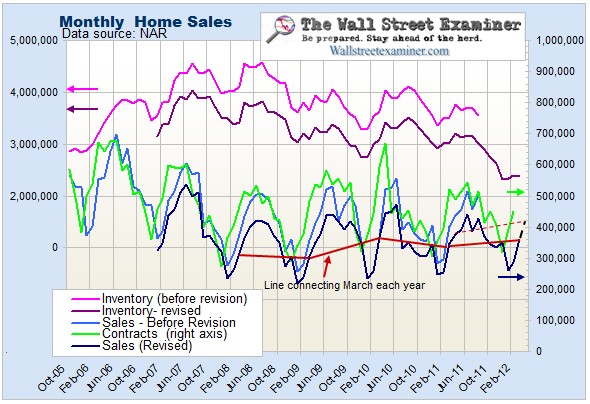
Listed House Sale Closings Rose 74,000 in March, Prices up 5% in Month, 2.5% in Year
Courtesy of Lee Adler of the Wall Street Examiner
The NAR reported on Thursday that their members settled 361,000 house sales in March (actual, not seasonally manipulated), up 74,000 from February. The median price rose 5.27% versus February and was up 2.5% versus March 2011. This was the largest monthly percentage price gain since June 2005. The year over year gain was the first significant year over year increase, not influenced by government giveaways, since 2006.
The sales volume gains continue to track reported gains in sales contracts 2 months after the contracts. This is consistent with a typical average 60 day period between contract and settlement. March closed sales were 7.7% less than January contracts. This is an improvement over February when the difference was 10% and a strong improvement over January when it was a record 36%. The average drop rate for the previous year was 12%. This rate was less than 6% until 2008. Assuming a drop rate in April that is similar to this March’s, closed sales in April will be around 420,000 which would continue a trend of slow improvement since the 2009 lows.
The March increase was below average for the month. March sales were up by 94,000 in 2011 and 108,000 in 2010, a number which was skewed by government programs. The average March gain for the past 5 years has been 94,000. Based on a big jump in contracts in February, April closed sales should show stronger improvement when the data is released next month.
Total listings in March stood at 2,370,000, a decline of 30,000 since February. Normally, listing inventories increase slightly in March. But listing inventory is at its lowest level in 5 years. The February inventory to contracts ratio of 5.3 indicated a tighter market than at any time since 2006. Low absolute price levels are causing would be sellers to withhold inventory because they are unable or unwilling to sell at current levels. The market has reached an uneasy equilibrium at low levels of demand, supply, and price. Contrary to conventional wisdom, shadow inventory is not a threat in most areas of the US because it is either in non competitive locations, or is becoming physically depreciated to the point that it is no longer competitive with existing homes in good condition.
Closed sale price increases are tracking real time listing prices, as is the norm. Sellers are not wild eyed maniacs hoping for the best. They know the situation and have their ear to the ground via their agents. Current listings prices, have proven to be a good indicator of the direction of the price trend.
The median closed sale price of $163,800 in March was up 5.27% from the February median, and 2.5% from March 2011. This represents contracts that were mostly entered in January, the month which marked the low for US median listing prices reported by Housingtracker.net. Current listing prices as of April 16 are up 5.4% since then, but just 3.1% year over year.
Whether the market is truly in recovery, or just lying dead in the water, can’t be confirmed one way or the other, until the data becomes available for June, the usual peak month for prices and contract volume. That data will be available in mid August. The homebuilder’s survey data, which is a little more timely, could give a heads up. For a more in depth look at all the key housing indicators see the current Wall Street Examiner Professional Edition Housing Market Update.
Get regular updates the machinations of the Fed, Treasury, Primary Dealers and foreign central banks in the US market, in the Fed Report in the Professional Edition, Money Liquidity, and Real Estate Package. Click this link to try WSE’s Professional Edition risk free for 30 days!
© Copyright 2012, The Wall Street Examiner Company Inc. All rights reserved.


