Housing Data: Shiller Unaware Bernankinflation Winning
Courtesy of Lee Adler of the Wall Street Examiner
 Poor Robert Shiller is behind the curve
There were two major housing data releases today. One of them is important. The other was a misleading misdirection play, that is leaving its creator clueless.
Due to its peculiar and excessive smoothing methodology, the housing Case Chiller is always behind the curve. It uses a 3 month average of sale prices closed in the 3 months up to the last reported month, in this case December, January, and February. That means that the data represents the average price of contracts closed over a 3 month period with a time mid point of mid-November. Need I remind you, it is now the end of April. The Case Chiller data represents the market more than 5 months ago.
This would be like the Wall Street Journal reporting only the Down Jones Industrial Average 65 day moving average as of November 16. Really, who gives a crap about what the 3 month average of the Dow was 5 months ago? Do you? I didn’t think so. So why pay attention to the Case Chiller?
This is totally worthless data, yet the media continues to report it as if it means something.
Actually, there was a third release today. The Federal Housing Finance Agency (FHFA aka Foofah) monthly price index was also released today. The Foofah data is not quite as slow. It uses sales only from the last available month which in this case is February. It at least recognized that a turn took place for sales closed in February.
The Conmerce Department released its new home sales data. This is really crappy data because it uses a tiny sample survey that gets revised every month for 5 months until the sample size is statistically significant. That being said, it does have certain advantages, and the revisions have not been so large that they change the absolute direction of the index.
The new home sales price data, while more volatile than the ultrasmooth and useless Case Chiller, uses contract prices from the previous month, not closed sales from two, three or four months ago that went under contract two months before that. It is the most current index of actual contract selling prices, released with a lag of just a month. Trends can be isolated by deriving year to year changes. Median and average annual price changes in new home sales have shown consecutive steep increases in both the February and March data.
I watched an interview of Robert Shiller today. It was painful. He seemed confused and uncertain about what’s going on. Due to the painfully slow data collection and excessive data smoothing of the index bearing his name, Shiller has missed the turn. Professor, the supply demand equation has two parts. Low prices have cause supply to be withdrawn from the market, bringing it into equilibrium with historically weak demand. Bernanke inflationary policies are causing house prices to inflate, just like oil prices. Housing is a necessity. When it’s as cheap to own as it is to rent, and there’s too much free money around, guess what? Prices for necessities rise.
New house median sales prices were up 6.3% year over year in March. That was the second straight year over year increase. The new house average sale price was up 11.7%, also the second straight increase. Average price is skewed by product mix. The market isn’t up 11.7%, but it’s the direction and consistency of the data that’s important.
The NAR’s data for March showed its second straight monthly increase, at +5.7% for the month, with a year over year increase of +2.5%. And now the FHFA shows slight a year to year increase for sales closed in February mostly contracted in December, the weakest month of the year.
Current, real time national listing price indexes (Housingtracker.net) have shown excellent predictive value in reflecting in real time the direction of the lagging closed sale data. They have shown year to year increases since December and are up 3.7% year to year through this week. In March, at the time corresponding with the March new home sales contract data, they were also up 3.6%. In January, at the time corresponding with the NAR’s March closed sales data (on average, January contracts) they were up 2.9%. The NAR’s corresponding closed sales data showed an increase of 2.5%. A wide variety of data is consistent in showing year to year increases in prices for the first time without the benefit of tax giveaways, or pending increases in FHA fees.
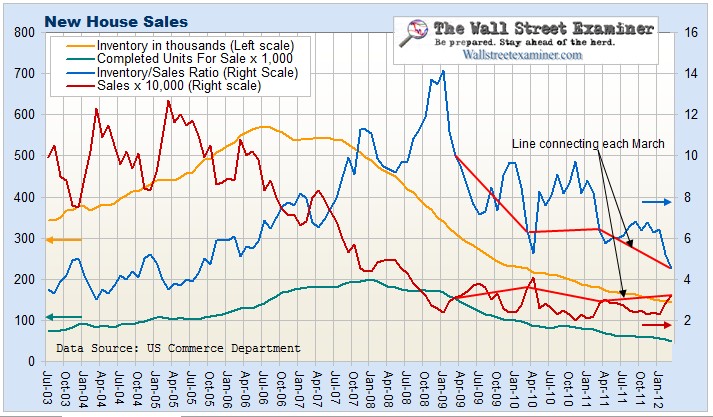
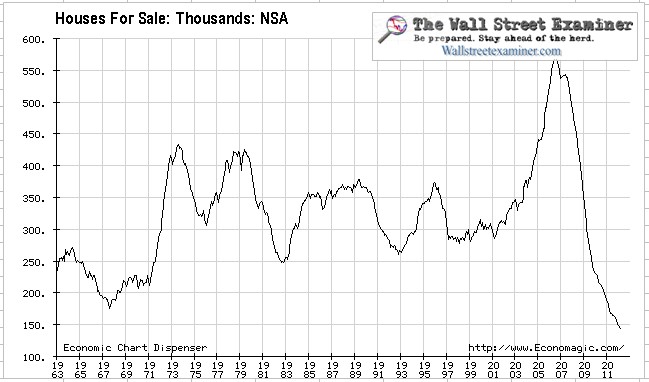
Actual, not seasonally fudged, builder new house inventory was revised down for each month from November to February. At 144,000 units, builder inventory is now at it’s lowest point in 50 years. That is not a typo. Five oh. The records only go back to 1963.
Furthermore, existing inventory is being made obsolete at a breakneck pace as the scary bogeyman called “shadow inventory” removes houses from the market through locational, physical, and functional obsolescence faster than they can be placed on the market. Shadow inventory is like shadow boxing. It isn’t going to hurt anyone, except the banks and institutions that own them, and ultimately the US taxpayer, who will be forced to pay for the banksters’ losses because Fannie and Freddie guaranteed most of those loans.
The new home sales actual inventory to sales ratio at 4.5 is the lowest since August 2005. Demand is historically weak, but supply is now aligned with that fact. An uneasy equilibrium has been reached.
Completed units in inventory were revised down 3 of the last 4 months. At 48,000, completed unit inventory has never been even remotely close to being this low.
Not seasonally adjusted actual monthly sales were revised up for all months November to February. That is the first time I’ve seen that in 7 years of watching this data closely. Sales are still extremely weak historically, but tight supply and Bernanke’s unholy suppression of interest rates are reigniting inflation. Shiller says that housing will stay depressed for a generation. I’d fade him. If anything, prices will surprise to the upside much sooner than anyone thinks.
Get regular updates the machinations of the Fed, Treasury, Primary Dealers and foreign central banks in the US market, in the Fed Report in the Professional Edition, Money Liquidity, and Real Estate Package. Click this link to try WSE’s Professional Edition risk free for 30 days!
Copyright © 2012 The Wall Street Examiner. All Rights Reserved. The above may be reposted with attribution and a prominent link to the The Wall Street Examiner.


