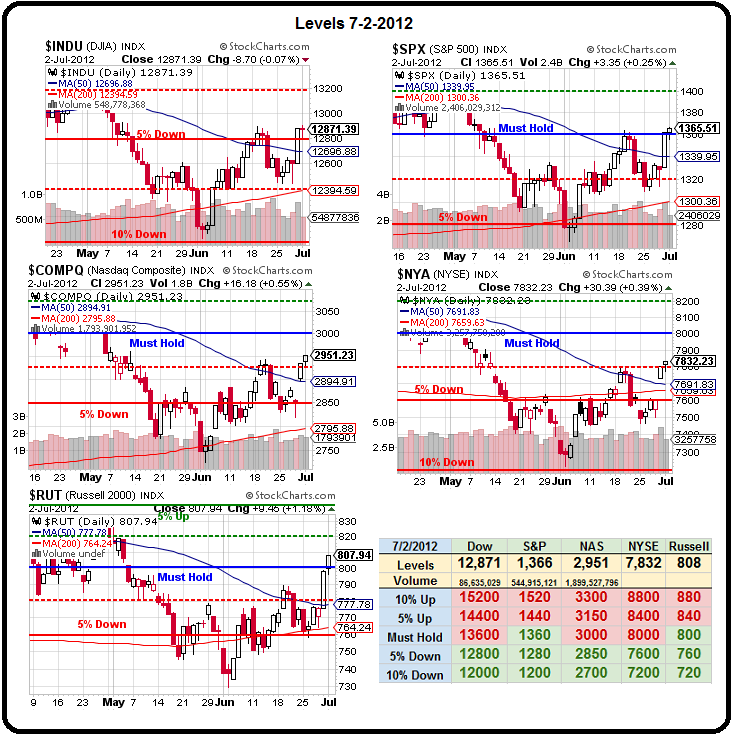
 As I said yesterday, we're still looking "constructively bullish" on our Big Chart as long as we hold those lines:
Looks can, of course, be deceiving. Keep in mind that this entire pop to form the right-hand top of a very nasty "M" pattern, that can take us right back to the June lows by the end of the month, is the result of the G20 holding hands and singing Kum Ba Yah – along with a few hundred Billion in extra stimulus and, of course, RULE CHANGES that create stealth stimulus.
So, when you have a leak in a $60Tn pool and the water level is down to $55Tn and you pour in $12Tn worth of stimulus and, 3 years later, the water level is only back to $59Tn – do you say "all we need is another Trillion and we're done" or should you be looking for the leak that continues to drain $8Tn over 3 years from the Global Economic Swimming Pool?
If we don't address the problem (unemployment, inadequate tax collections) – we're never going to find a lasting solution, are we?
 On the other hand, if your pool is leaking at a rate of $8Tn over 3 years, that's "only" $222Bn a month so any month you dump more than $222Bn worth of Global Stimulus into the pool, you will see the economic levels rising and you can declare things to be "fixed" and all the bulls can jump in and play again until the next time the activity levels get dangerously close to the line at which the pumps seize up and then we have more meetings and do it all over again.
We have to accept the fact that our "leaders" are unwilling or unable to fix the actual leak and this is essentially the cycle we will have to put up with. If we assume we have an infinite amount of stimulus to keep pumping our economic pool back up – then this system is just fine but, judging from the way they had to scrape up this recent few hundred Billion – do we even have enough ($1.2Tn) fresh water to get us through the end of the year?
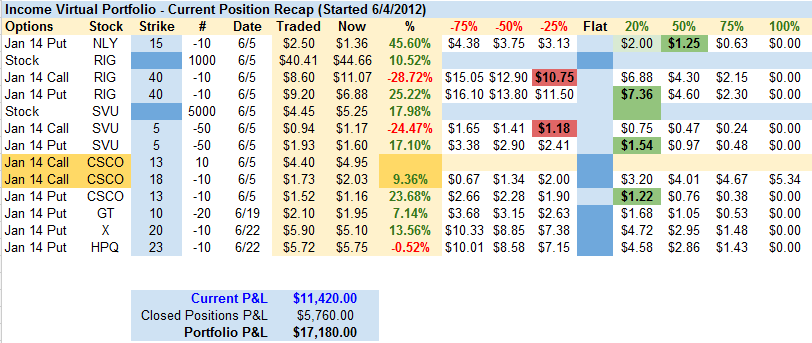
As planned in yesterday's pre-market post, we cashed in our DIA $129 calls in the morning and that left us a bit bearish in our small portfolios. Our main portfolio, the Income Portfolio, still remains bullish as it's long-term. In fact, it's very long-term as we already took the money and ran on our July and January positions, leaving us with all 2014 short puts and spreads but up a stunning $17,180 in our first month of virtual trading with our new portfolio:

Note that $11,420 of our gains are unrealized (NLY needs to come off as it's too far ahead to risk) so the question is – do we need to protect them? As our goal was to make $4,000 a month and we're already 3 months ahead of schedule with very little of our cash deployed. To some extent our gains become a hedge but that does not mean we should be cavalier about giving them back, does it? On the other hand, if we hedge we are essentially spending part of our gains on insurance and, although we did very well with last year's Income Portfolio – our biggest mistake was over-hedging – playing it a little TOO cautious.
 So, we will pay very close attention to the 5% lines on our Big Chart especially our 1,360 line on the S&P (see Blain's charts in Chart School) and we'll have no tolerance for a failure of our indices to hold that "constructively bullish" posture because we certainly did not get enough stimulus to give us much more than the quick little boost we've gotten so far and only rumors of more to come are really keeping things going at the moment. As with our $25,000 Portfolio – after getting so much ahead of our goals, it would be a relief to get back to cash and wait patiently for the next real buying opportunity.
We have no technical reason to be bearish and there WAS a lot of stimulus pumped in over the last couple of weeks so we SHOULD be good at least until earnings kick off in a week – at which point 9,000 reporting companies will have a chance to poke fresh holes in the economic dyke.
 To some extent, we are probably having a bit of a short squeeze on G20 action but it's done nothing to shift the EXTREME bearishness we're seeing on the Sell Side Consensus Indicator, for example.
Conventional wisdom dictates that, when bearishness gets this extreme – it's a good idea to bet against it and we have been but in Jan of 2009, people were right to be bearish as the Dow dropped 25% into March. I think it's a bit silly to look back another 10 years and try to compare the situation at that time. What this chart tells you is that analysts are idiots and sheep and you follow them at your peril – THAT is an important lesson to learn!
 As to the logic that "if everyone is bearish, we should be bullish" – that's nonsense. If my daughter's 10-year old football team is given the opportunity to square off against the NY Giants in a game the Giants need to win – I'm pretty sure even the proud parents of her football squad would have a hard time placing bets on the Panthers winning the game. Would the fact that we are all bearish on my daughter's chances mean you should bet on her team to win or might it be the accurate assessment of the situation? Don't get sucked into being a Contrarian "just because."
As you can see from the picture on the right, we have a global economy that is about $60 TRILLION in debt and that is the entirety of our GDP but we can't use the entirety of our GDP to pay off the debt as we use it to live. Not only do we use it to live but we are, as I noted above, running another $3Tn a year (5%) more into debt and this does not, of course, include hundreds of Trillions of Dollars of unfunded liabilities like health care and pension benefits for aging populations and don't even think about $350 TRILLION worth of derivatives that are floating about or it might ruin your holiday.
We've got BIG PROBLEMS and, so far – only small solutions.
Let's be careful out there…
Have a great Holiday,
– Phil


