

HOW TO BUY LEADING STOCKS AT SUPPORT
Courtesy of David of All About Trends
Chart notes on AAPL this week:
10-1: Where is the "What Do I Need To See To Make Me Take A Trade"?,
I call it the "Gimme Trade" — it's the 50 day average in the face of fear.
9-30: A tag of the 50 day in the face of fear sure would be a nice area to go long AAPL
For weeks we've also been addressing the question:
"What Do I Need To See To Make Me Take A Trade"
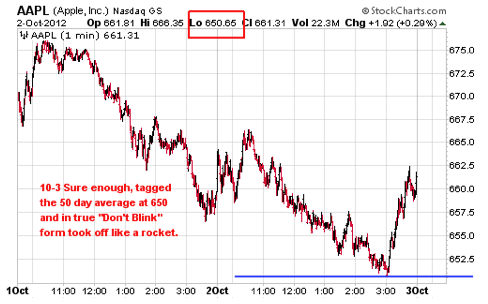
It's a powerful centering statement. The 50 day average ($650) was laid out on the daily charts as a zone. Yesterday, as the chart below shows, AAPL tagged the 50 day average in true "Don't Blink" form and then it was off to the races.
Now what?
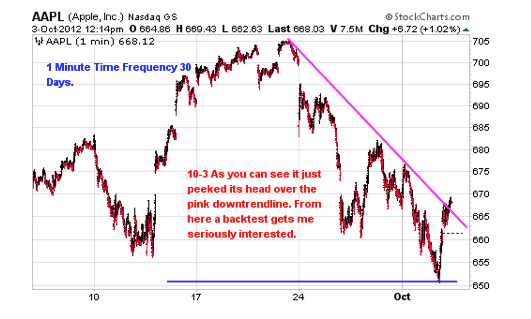
Let's look at the one minute, 30-day time frequency chart to decide.
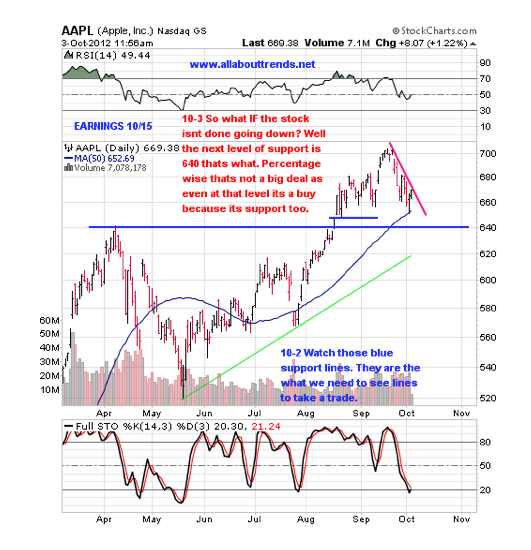
So what's the lesson? Look at the charts for support levels and 50 day averages.
To learn more about how to trade AAPL and other leading stocks in tandem with us – sign up for our free newsletter and receive our free report – “How To Outperform 90% Of Wall Street With Just $500 A Week.”
*****
Want to know more? Visit our web site. Have you enjoyed good results from our newsletter or have a comment or question? Contact us at customerservice@allabouttrends.net. We'd love to hear from you. If you enjoy these newsletters, tell a friend!
Finally, we have a public list at www.stockcharts.com — you can help us out by voting for it each day. At the bottom of our list is a place to vote for us. Voting for us each day helps our list get closer to the top which means more visibility and more subscribers and more opportunity for us to help others like you be successful.
THESE ARE NOT BUY RECOMMENDATIONS! Comments contained in the body of this report are technical opinions only. The material herein has been obtained from sources believed to be reliable and accurate, however, its accuracy and completeness cannot be guaranteed. Allabouttrends.net is not an investment advisor, hence it does not endorse or recommend any securities or other investments. Any recommendation contained in this report may not be suitable for all investors and it is not to be deemed an offer or solicitation on our part with respect to the purchase or sale of any securities. All trademarks, service marks and trade namesappearing in this report are the property of their respective owners, and are likewise used for identification purposes only. The member/subscriber agrees that he/she alone bears complete responsibility for his/her own investment/trading decisions. Allabouttrends.net shall not be liable to anyone for any loss, injury or damage resulting from the use of any information. Trade at you're own risk, this information is strictly for educational and informational purposes only. Allabouttrends.net assumes NO responsibility whatsoever for any losses experienced by anyone who uses its educational materials to make financial decisions. All charts courtesy of stockcharts.com.