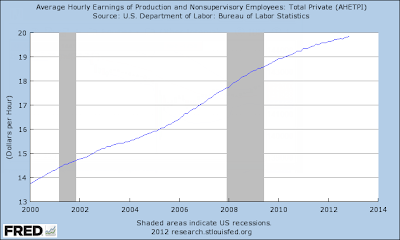
Courtesy of Mish.
Since 2000, how much has your average hourly wage gone up?
If you are in the upper crust, the answer may be staggering. If not, perhaps the following chart more closely resembles your experience.
Average Hourly Earnings 2000-2012
Just the Facts Ma’am
- The average hourly earnings was $13.75 on January 1, 2000.
- The average hourly earnings is currently $19.84.
- Since 2000, average hourly earnings are up 44.29%
Bear in mind, those are averages. Don’t be surprised if you are much worse off because of distributional skew (huge wage increases at the high end pull the average up).
Moreover, the above chart does not reflect sales taxes, property taxes, state income taxes, gasoline taxes, fees, etc., all of which are way higher now than in 2000. In other words, the chart reflects average hourly wages, not spendable income.
Actual spendable income is up far less than 44%.
It’s a peculiar thing how the CPI does not properly account for tax hikes.
While pondering those thoughts, please consider federal spending.
Federal Spending…


