Courtesy of Lee Adler of the Wall Street Examiner
The BLS today reported a seasonally adjusted (SA) gain of 155,000 in December nonfarm payrolls. While the number met consensus expectations, there were a few problems below the surface of the headlines.
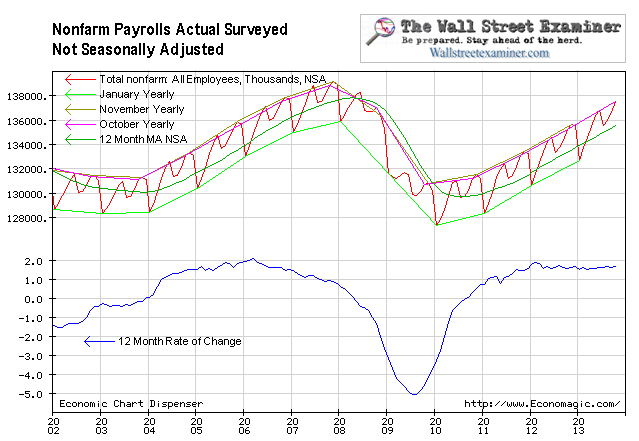
The SA number compared with a decline of 243,000 in the actual, not seasonally adjusted number (NSA). Don’t be alarmed by that. December is always a down month. Last year the December NSA decline was 207,000. In 2010, it was 296,000. The 10 year average decline for December for 2002 to 2011 was 343,000. However, that was skewed by two very bad years, 2008 and 2009. This year’s number was better than 4 of the past 10 years, including 2008 and 2009. It was therefore only so-so. The seasonal adjustment methodology gives the catastrophic numbers of 2008 and 2009 equal weight with every other year even though they were huge outliers relative to the normal range of monthly change. As a result, the December SA number looked a little better than it actually was.
There’s always a problem with the seasonally adjusted fictional number. The BLS will revise this month’s number, not only next month and the month after, but every year for the next 5 years as it hones the SA number to include a look back to pinpoint where this month’s number actually should have been, as it works toward making the idealized seasonally adjusted curve fit the actual data. It will have a major revision in February when the final benchmark revisions for 2012 are applied. The current SA number is only half way through the iteration process to the final number that the BLS will assign to this month 5 years from now.
The BLS statisticians know that the SA number is ginned up and it has publicized its statistical weaknesses, but the economic establishment and mainstream media have ignored the warnings for years. We need to look at the best data we can find to know the truth about what’s going on. The actual NSA data, while an estimate based on a tiny survey sample, is much closer to reality than the seasonal adjusted abstract impressionism. The NSA number is not massaged to represent an idealized curve with seasonal tendencies filtered out.
By analyzing charts of the raw data in ways with which market technical analysts and chartists are familiar but economists are not, we can get a much clearer picture of the trend, including seeing early signs of when the trend is changing. Economists deal with an idealized world they think should exist. They are always shocked when faced with the undeniable evidence that it doesn’t, but they remain in denial, and the mainstream media likewise remains in their thrall.
As Yogi Berra was fond of pointing out, “In theory, there’s no difference between theory and practice. In practice there is.” Unlike economists who are constantly trying to make reality fit their theories, technicians and traders are simply trying to read the data and identify the trend as it actually unfolds in practice, and trade the markets on that basis. They understand the repetitive nature of the patterns of human behavior that are revealed in the charts and they recognize signs of change ahead.
This month, in spite of the fact that the actual data was a bit weaker than the headlines implied, it was still smack on the trend of the past year. The number of jobs has been growing at virtually the same rate for the past 17 months. There’s nothing profound or new here, and therefore no reason to think that the markets will change course. Nor is there any reason to think that the Fed will change policy any time soon, in spite of the FOMC minutes propaganda trying to scare speculators away from buying inflation hedges, by posing the threat that QE will end this year. The guessing that the Fed will end QE is just a guess, and it’s just what the Fed wants speculators to be thinking about, lest they go wild driving gold and energy prices higher.
The numbers above come from the BLS the Current Employment Statistics Survey or CES, a survey of business establishments. The BLS also does a survey of households. For more charts and analysis of the issues raised by the CPS this month, please visit the Employment charts page.
Get regular updates the machinations of the Fed, Treasury, Primary Dealers and foreign central banks in the US market, in the Fed Report in the Professional Edition, Money Liquidity, and Real Estate Package. Click this link to try WSE's Professional Edition risk free for 30 days!
Copyright © 2012 The Wall Street Examiner. All Rights Reserved. The above may be reposted with attribution and a prominent link to the Wall Street Examiner.


