Courtesy of Mish.
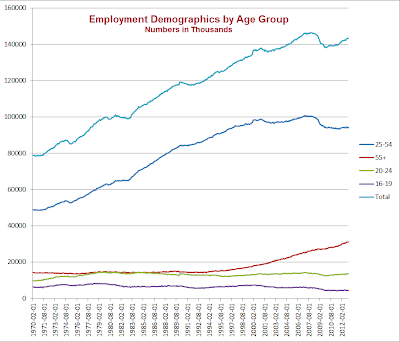
Last month I posted a chart showing employment by age group. Here is an update as of Friday’s job release.
Employment Demographics by Age Group
click on chart for sharper image
Note that 100% of the job growth since the recession is in age group 55 and over.
Last month, someone proposed the above chart was blatantly misleading because it does not reflect the aging workforce.
Let’s investigate that hypothesis with a look at actual data (numbers in tables and charts in thousands).
Civilian Institutional Population (CP) and Labor Force (LF)
| Year | 16-19 CP | 20-24 CP | 25-54 CP | 55+ CP | 16-19 LF | 20-24 LF | 25-54 LF | 55+ LF |
|---|---|---|---|---|---|---|---|---|
| 2000 | 15912 | 18311 | 120656 | 57697 | 8271 | 14250 | 101393 | 18668 |
| 2001 | 15929 | 18877 | 121604 | 58683 | 7902 | 14557 | 101789 | 19485 |
| 2002 | 15994 | 19348 | 122077 | 60151 | 7585 | 14781 | 101719 | 20778 |
| 2003 | 16096 | 19801 | 123289 | 61981 | 7170 | 14928 | 102309 | 22104 |
| 2004 | 16222 | 20197 | 123410 | 63527 | 7114 | 15154 | 102122 | 23011 |
| 2005 | 16398 | 20276 | 124175 | 65233 | 7164 | 15127 | 102773 | 24257 |
| 2006 | 16678 | 20265 | 124884 | 66988 | 7281 | 15113 | 103566 | 25468 |
| 2007 | 16982 | 20427 | 125696 | 68761 | 7012 | 15205 | 104353 | 26554 |
| 2008 | 17075 | 20409 | 125652 | 70652 | 6858 | 15174 | 104396 | 27858 |
| 2009 | 17043 | 20524 | 125565 | 72668 | 6390 | 14971 | 103742 | 29040 |
| 2010 | 16901 | 21047 | 125290 | 74591 | 5906 | 15028 | 102940 | 30014 |
| 2011 | 16774 | 21423 | 124704 | 76716 | 5727 | 15270 | 101744 | 30876 |
| 2012 | 16984 | 21799 | 124314 | 80187 | 5823 | 15462 | 101253 | 32437 |
Age Group 25-54 Key Facts
- In 2007 the civilian population was 125,652,000
- In 2007 the labor force was 104,353,000
- In 2012 the civilian population was 124,314,000
- In 2012 the labor force was 101,253,000
Numbers are non-adjusted from BLS tables.
…


