Silver Lining Play on Tiffany’s Plunge
Courtesy of Paul Price
High-end retailer Tiffany (TIF, $60.28) has posted excellent long-term results. Tiffany’s took a hit last Thursday after lowering guidance to $3.20 per share for the fiscal year ending Jan. 31, 2013. This will be just its third negative year-over-year comparison of the past decade.
Traders who bought when negative sentiment was running wild in 2004 and 2009 ended up doing very well. Good news during peak profit periods like 2005, 2007 and 2011 chased TIF shares to price pinnacles at P/Es of 23x – 25x. Those who bought when ‘all clear’ signs were flashing are the ones who eventually suffered buyers’ remorse.

Tiffany offers a well-covered and growing 2.15% current yield. Its balance sheet is solid. The shares are a buy.
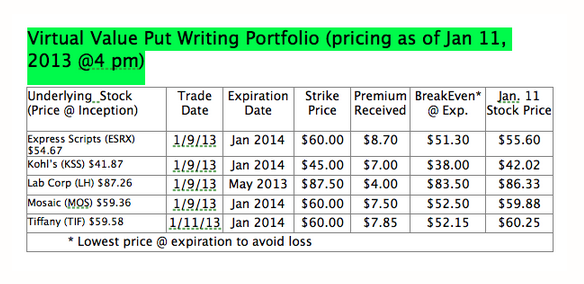
I would consider either buying a small position in the stock or simply selling a one-year put at a $60 strike price (one Jan 2014 $60 put). Here is last Friday’s (1/11/13) morning quote (note that TIF stock is up slightly since Friday morning, and the put price is down from $7.95 to $7.85):

If we sold one of these, here are the result possibilities:
If TIF closes above $60 at expiration on Jan 17, 2014:
- $60 strike put would expire worthless
- We’d keep $7.85 per contract (put option) sold as 100% profit
- We would not be obligated to buy any TIF shares
This best-case scenario results in a net profit = $785/contract on a $1,200 margin requirement.
If TIF closes below $60 at expiration on Jan 17, 2014:
- The $60 put would be exercised
- We’d be forced to buy 100 TIF shares/contract (one put = one contract)
- We’d need to lay out $6,000 in cash/contract
- Our final position will be long 100 TIF shares /contract (at a net price of $60 – $7.85 or $52.15 per share)
This worst-case scenario would compute to a net outlay of $6,000 – $785 = $5,215 per contract (put).
Our break-even price of $52.15 per share means any decline of less than 7% would not result in a net loss. Tiffany’s absolute bottoms in 2011 and 2012 were $54.60 and $49.72, respectively, and I think the risk is low.
We are going to add selling one TIF Jan 2014 $60 put to our new Virtual Selling Puts Portfolio.


