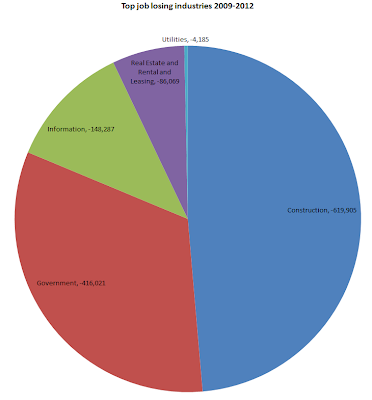
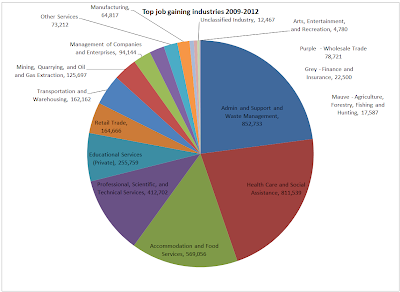
Courtesy of Mish.
This is part three in a series of articles on jobs gained and lost since December 2007.
The first article was an interactive map from Tableau: Job Gains and Losses in the Recovery by Job Type (Healthcare, Education, Mining, Construction, Finance, Real Estate, etc).
The second article Job Gaining and Job Losing Industries 2007-2012 displayed data in an interesting pie chart fashion by Salil Mehta who has a blog on Statistical Ideas.
This article contains another look at the data, but focus is on jobs gained or lost in the recovery.
Data for all three posts is courtesy of Economic Modeling Specialists.
The recession ended in June of 2009, but the data I have is annual. Data in the following charts uses December of 2009 as a proxy for the start of the recovery. Once again, pie charts are by Salil Mehta.
Click on any chart for sharper image.
Top Losing Jobs in the Recovery
Top Gaining Jobs in the Recovery


