

The Scariest Stock Chart in Town
Courtesy of Joshua M Brown, The Reformed Broker
Forgive the headline, I'm auditioning for a summer internship at The Business Insider.
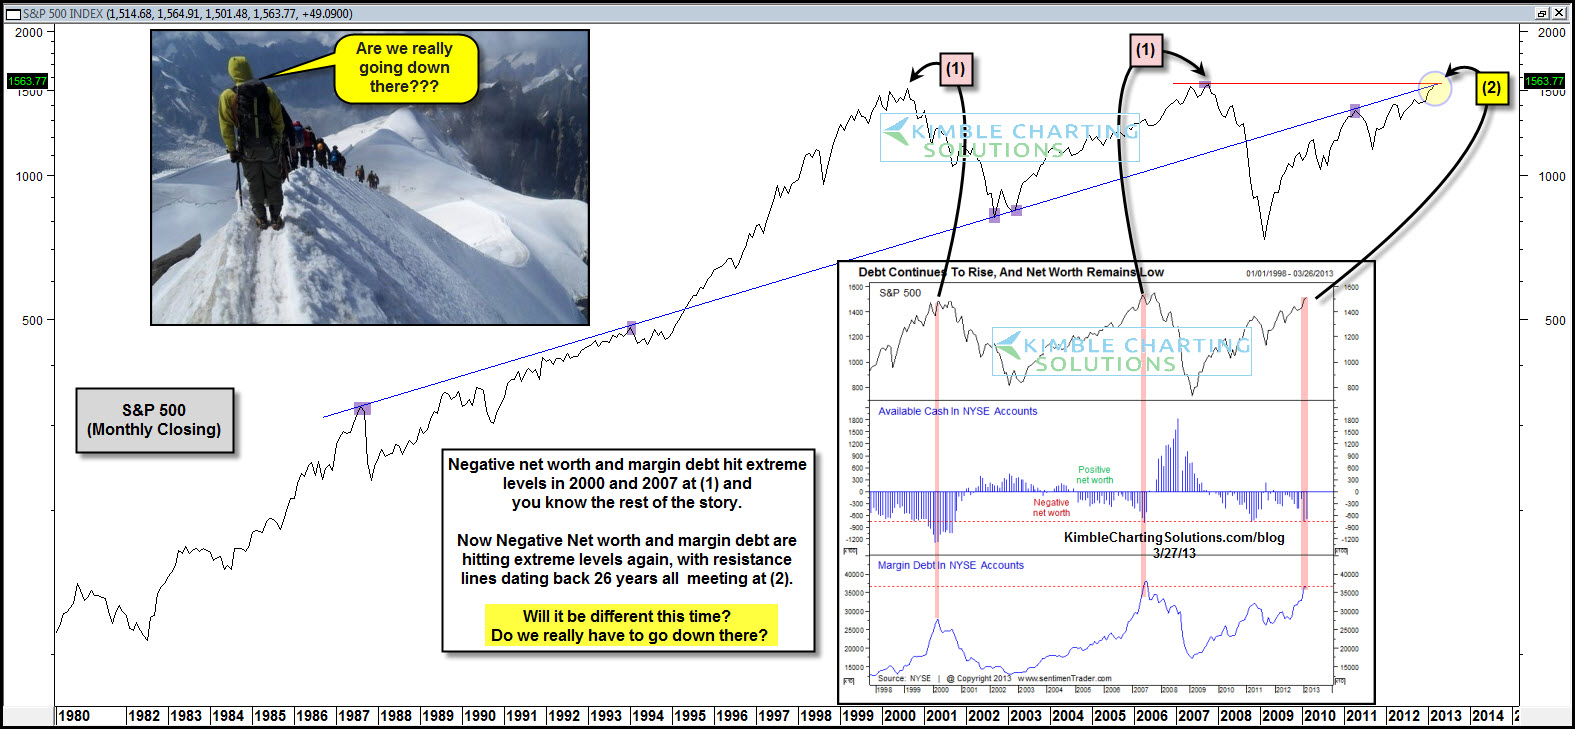
Anyway, this is some scary shit, probably the chart I hate the most right now. Chris Kimble at Kimble Charting Solutions shows us the S&P 500 versus NYSE cash available in brokerage accounts as well as an overlay of the margin debt chart. All measures are at extremes not seen since the prior to market peaks of 2000 and 2007.
Will history repeat?
Click to Embiggen:
Source: