Courtesy of Sabrient Systems and Gradient Analytics
 Stocks finished the month of April breaking to new highs, with the S&P 500 rising above 1597. But May Day selling put a temporary hold on the bullish celebration that will certainly occur if the S&P 500 can make a clean break above psychological resistance at 1600. Was May Day the start of the usual “Sell in May and go away” practice? Time will tell, and there’s little doubt that stocks appear to be running low on fuel at this point.
But my bet is that new highs are coming sooner than later. Stocks have shown an impressive propensity to simply churn in place when many observers expect a major correction.
On Wednesday, the Federal Reserve announced that it would maintain its bond purchase program at $85 billion per month and keep its interest rate target at zero to 0.25%. Weak economic reports like the ADP payroll report and manufacturing suggested that the economy is still struggling. Next up is the European Central Bank policy announcement, in which it is expected to lower its main interest rate by 25 bps to 0.5%.
Although corporate earnings generally have been beating estimates, revenue growth has lagged. Some analysts are worried that companies’ ability to continue propping up earnings through cost-cutting and productivity gains will become more difficult going forward.
Apple (AAPL) caused quite a stir this week when it rolled out the largest non-bank bond deal in history, $17 billion. The firm intends to use the funds to return as much as $100 billion in cash to its shareholders. Before this, AAPL was the only major technology company without any debt on its books.
This year’s rally continues to be led by defensive sectors healthcare, utilities, and consumer staples. Looking at the iShares US sector ETFs, Healthcare (IYH) and Utilities (IDU) are both up 18.4% year-to-date through May 1, and Consumer Goods (IYK) is up 16.5%. Compare this to the SPDR S&P500 Trust (SPY), up 11.6%, and the Guggenheim S&P 500 Equal Weight (RSP), up 13.0% YTD.
Moreover, let’s compare some low-volatility ETFs. Guggenheim Defensive Equity (DEF), which tracks the Sabrient Defensive Equity (DEF), is up 15.9% and the PowerShares S&P500 Low Volatility (SPLV) is up 16.4%. These defensive plays are generally expected to lag when the market is strong like it has been. But instead they have been leading, providing further examples of investors’ appetite for lower-risk, dividend-paying blue chips and value stocks.
Can it continue this way? My feeling is that a rotation into economically-sensitive sectors, and from value into growth, will have to come in order to provide fuel for the next leg up.
By the way, Sabrient’s “Baker’s Dozen” top 13 stocks for 2013 closed Wednesday up 11.7% since its inception on January 11. Over the same timeframe, the S&P 500 is up 7.6%. The portfolio’s performance is led by 20%+ gains in EPL Oil & Gas (EPL), Alaska Air Group (ALK), Genworth Financial (GNW), and Air Lease (AL).
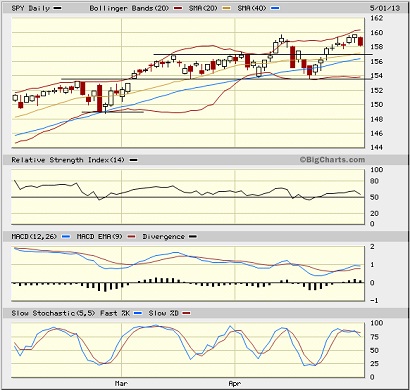
Looking at the chart of the SPY, it closed Wednesday at 158.28. It has been tantalizingly close to 160, which of course corresponds with 1600 on the S&P 500, which is psychological resistance. Support has been coming in at the 20-day simple moving average, 50-day SMA, and the bottom line of the sideways channel at 153.5. It might be ready to test resistance-turned-support at 157, as the oscillators like RSI, MACD, and Slow Stochastic are all rolling over..

The CBOE Market Volatility Index (VIX), a.k.a. “fear gauge,” closed Wednesday at 14.49. It is still at levels that are historically considered complacent, but in the current VIX environment, anything approaching 20 is showing elevated fear, and above 20 indicates a selloff in progress. For now, though, there is no apparent problem.
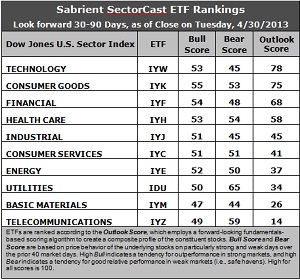
Latest rankings: The table ranks each of the ten U.S. business sector iShares ETFs by Sabrient’s proprietary Outlook Score, which employs a forward-looking, fundamentals-based, quantitative algorithm to create a bottom-up composite profile of the constituent stocks within the ETF. The multi-factor model considers forward valuation, historical earnings trends, earnings growth prospects, the dynamics of Wall Street analysts’ consensus estimates, accounting practices and earnings quality, and various return ratios. In addition, the table also shows Sabrient’s proprietary Bull Score and Bear Score for each ETF.
High Bull score indicates that stocks within the ETF have tended recently toward relative outperformance during particularly strong market periods, while a high Bear score indicates that stocks within the ETF have tended to hold up relatively well during particularly weak market periods. Bull and Bear are backward-looking indicators of recent sentiment trend.
As a group, these three scores can be quite helpful for positioning a portfolio for a given set of anticipated market conditions.

Observations:
1. Technology (IYW) stays at the top ranking with an Outlook score of 78, which is the same as last week, followed again by defensive sector Consumer Goods (IYK) at 75. Financial (IYF) rose back to the top three with a 68. IYW continues to display a low forward P/E, strong projected long-term growth, and the best trailing return ratios. The only chink in its armor is the continued reduction in earnings estimates among Wall Street analysts. On the other hand, stocks within IYK have enjoyed increasing support from Wall Street (i.e., net upgrades in forward earnings estimates). In fact, defensive sectors Telecom (IYZ) and Utilities (IDU) are also enjoying the best sell-side support.
2. Telecom (IYZ) stays in the cellar with an Outlook score of 14. It is weak in forward P/E, long-term projected growth, and trailing return ratios. It is joined in the bottom two again this week by Basic Materials (IYM), which is seeing acceleration in Wall Street earnings downgrades.
3. This week’s rankings are looking a little less defensive and more bullish. Tech (IYW), Financial (IYF), and Industrial (IYJ) are all in the top five, and economically-important Consumer Services (IYC) has risen into the sixth spot.
4. Looking at the Bull scores, IYK is the surprising leader on particularly strong market days, scoring 55, followed closely by IYF, while IYM is the laggard on strong market days, scoring 47. But the top-bottom spread is still narrow at only 8 points, which continues to indicate high sector correlation on strongly bullish days.
5. Looking at the Bear scores, Utilities (IDU) is serving as the favorite “safe haven” on weak market days, scoring 65, while IYM is the worst during extreme market weakness as reflected in its low Bear score of 44. The top-bottom spread is 21 points, which continues to indicate lower correlations on weak market days — i.e., it pays to be in the safe sectors when the market is bearish.
6. Overall, Consumer Goods (IYK) shows the best all-weather combination of Outlook/Bull/Bear scores. Adding up the three scores gives a total of 183. Basic Materials (IYM) is the worst at 117. Looking at just the Bull/Bear combination, Utilities (IDU) shows an impressive total score of 115. Materials (IYM) displays by far the lowest score at 91. This indicates that Utilities stocks have performed the best in extreme market conditions (whether bullish or bearish) while Materials stocks are avoided altogether.
These Outlook scores represent the view that Technology and Consumer Goods sectors may be relatively undervalued, while Telecom and Basic Materials sectors may be relatively overvalued based on our 1-3 month forward look.
Some top-ranked stocks within Technology and Consumer Goods include CACI International (CACI), Western Digital (WDC), BorgWarner (BWA), and Carter’s Inc (CRI).
Disclosure: Author has no positions in stocks or ETFs mentioned.
About SectorCast: Rankings are based on Sabrient’s SectorCast model, which builds a composite profile of each equity ETF based on bottom-up aggregate scoring of the constituent stocks. The Outlook Score employs a fundamentals-based multi-factor approach considering forward valuation, earnings growth prospects, Wall Street analysts’ consensus revisions, accounting practices, and various return ratios. It has tested to be highly predictive for identifying the best (most undervalued) and worst (most overvalued) sectors, with a 1-3 month forward look.
Bull Score and Bear Score are based on the price behavior of the underlying stocks on particularly strong and weak days during the prior 40 market days. They reflect investor sentiment toward the stocks (on a relative basis) as either aggressive plays or safe havens. So, a high Bull score indicates that stocks within the ETF have tended recently toward relative outperformance during particularly strong market periods, while a high Bear score indicates that stocks within the ETF have tended to hold up relatively well during particularly weak market periods.
Thus, ETFs with high Bull scores generally perform better when the market is hot, ETFs with high Bear scores generally perform better when the market is weak, and ETFs with high Outlook scores generally perform well over time in various market conditions.
Of course, each ETF has a unique set of constituent stocks, so the sectors represented will score differently depending upon which set of ETFs is used. For Sector Detector, I use ten iShares ETFs representing the major U.S. business sectors.
About Trading Strategies: There are various ways to trade these rankings. First, you might run a sector rotation strategy in which you buy long the top 2-4 ETFs from SectorCast-ETF, rebalancing either on a fixed schedule (e.g., monthly or quarterly) or when the rankings change significantly. Another alternative is to enhance a position in the SPDR Trust exchange-traded fund (SPY) depending upon your market bias. If you are bullish on the broad market, you can go long the SPY and enhance it with additional long positions in the top-ranked sector ETFs. Conversely, if you are bearish and short (or buy puts on) the SPY, you could also consider shorting the two lowest-ranked sector ETFs to enhance your short bias.
However, if you prefer not to bet on market direction, you could try a market-neutral, long/short trade—that is, go long (or buy call options on) the top-ranked ETFs and short (or buy put options on) the lowest-ranked ETFs. And here’s a more aggressive strategy to consider: You might trade some of the highest and lowest ranked stocks from within those top and bottom-ranked ETFs.


