Courtesy of Lee Adler of the Wall Street Examiner
The BLS today reported a seasonally adjusted (SA) gain of 165,000 in April nonfarm payrolls, beating the consensus estimates of 140,000 to 155,000 from surveys of economists by mainstream media organizations.
Surprise, surprise (not) both February and March were revised up by the BLS. “The change in total nonfarm payroll employment for February was revised from +268,000 to +332,000, and the change for March was revised from +88,000 to +138,000. With these revisions, employment gains in February and March combined were 114,000 higher than previously reported.”
We had seen in last month’s report that the numbers reported at that time weren’t consistent with the much stronger gains in withholding taxes reported daily in real time by the Treasury Department. Apparently economists again paid no attention to that data, which I covered in Thursday’s report on first time unemployment claims.
Obviously I wasn’t sure that my guestimate was correct, or that the market would break out, but I was leaning in that direction and had told Professional Edition subscribers that over the past couple of days. It’s no secret that I’ve been foaming at the mouth bullish because I believe that central banks are rigging the markets and that that rigging has been effective.
Can I prove cause and effect? No, but as I show weekly in the Fed and Treasury reports (subscription required), the circumstantial evidence has been and continues to be overwhelming. What the central banks cannot do is cause economic growth to track the inflation of financial asset prices. In that respect, I believe that they are absolutely doomed to failure. The only things they can accomplish are the promulgation of asset bubbles or consumer price inflation. They’ve been able to ignite asset bubbles. They’ve had a run of good luck in suppressing reported consumer price inflation. I do not know how long they can be successful at that.
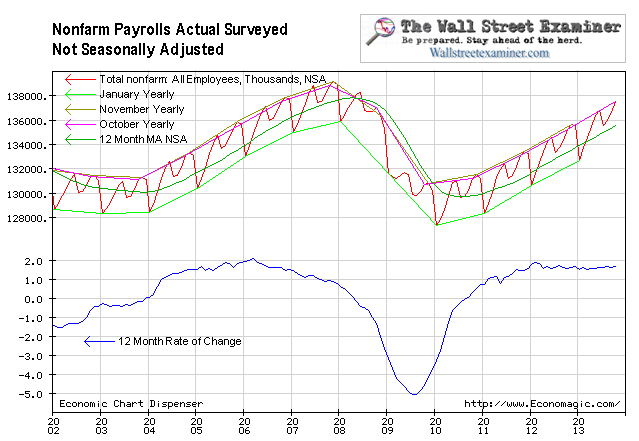
Meanwhile, back to the employment data, the SA number compares with a gain of 932,000 in the actual, not seasonally adjusted, number (NSA). Since this number is not seasonally finagled we must look at past years to judge whether it’s good, so-so, or lousy. Last year the April NSA gain was 895,000. In 2011, it was, wow, 1,218,000. The 10 year average increase for April 2003 to 2012 was 864,000, pulled down by an extremely weak year in 2009. This year’s number was about average if you exclude 2009.
The NSA number is not massaged to represent an idealized curve with seasonal tendencies filtered out. The actual data was again smack on the trend of the past year, just like last month when the headline SA number was grossly understated. The number of jobs has been growing at virtually the same rate for the past 18 months, around 1.5% per year, give or take a tenth or two. QE 3-4, which was announced in September 2012, with the cash flow starting in November, has not changed the growth rate one iota.
So the truth is that nothing happened this month. There’s nothing profound or new here, and therefore no reason to think that the markets will change course.
If we extrapolate 1.5% jobs growth against 1% population growth, we could theoretically calculate the point in time that the unemployment rate would fall to the Fed’s target of 6.5%. I won’t go there in this post. A pundit tweeted today that it would happen by November. I don’t know if that’s right or not, but let’s see what the next couple of month’s bring. If this continues along the same path the chatter about a Fed tapering or ending of QE will begin to grow, and the market will be buffeted by that. But as long as the Fed cash is flowing, the stock market trend should remain intact.
The numbers above come from the BLS, the Current Employment Statistics Survey or CES, a survey of business establishments. The BLS also does a survey of households. The household survey or CPS — Current Population Survey – sometimes tells a different story from the establishment survey. It’s also important in that it breaks out full time employment from total employment so that we can analyze that important metric separately. That story continues in Part 2 of this report.
Get regular updates the machinations of the Fed, Treasury, Primary Dealers and foreign central banks in the US market, in the Fed Report in the Professional Edition, Money Liquidity, and Real Estate Package. Click this link to try WSE's Professional Edition risk free for 30 days!
Read Also:
Full Time Jobs Number Increases… To Levels Reached in Year 2002
Wages and Hours Worked Falling, Let The Money Printing Go On!
Downtrend In Claims, Uptrend in Withholding, Suggest Blowout Jobs Number As Stocks Bubble
Copyright © 2012 The Wall Street Examiner. All Rights Reserved. The above may be reposted with attribution and a prominent link to the Wall Street Examiner.


