Courtesy of Mish.
Month in and month out I see unwarranted optimism in Europe and in the US.
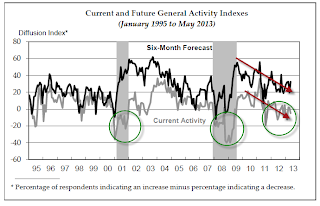
For example, on Thursday I stated “Philly Fed Slips Into Contraction (Again); Current Conditions Recessionary, Future Expectations Far Too Optimistic”.
Here is the chart I posted:
That chart got me to wondering “just how wrong are future expectations historically?” The data is available, all one has to do is chart it.
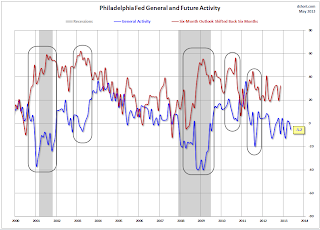
I asked Doug Short at Advisor Perspectives if he could produce a chart of future expectations offset by six months to see how expectations actually matched what did happen. Doug graciously produced a pair of charts.
click on either chart for sharper image
Future Expectations Shifted 6 Months Forward vs. Actual Results
Note that manufacturers in the Philly region are especially clueless during recessions as to how fast things will improve. They can be wildly off at other times too, as shown by the black ovals.
Since the Philly Fed index is generally noisy (huge month-to-month random fluctuations), we decided to smooth out the lines by showing a 3-month rolling average of current conditions vs. a 3-month rolling average of future expectations.
…


