Courtesy of Sabrient Systems and Gradient Analytics
 Central banks reiterated their commitment to supporting the global economy, and US investors showed their approval. The central banks are clearly prepared to keep the liquidity flowing for now, austerity be damned. Such statements are music to investors’ ears.
On Tuesday, stocks raced out of the gate and closed at new highs yet again, while bonds fell such that Treasury yields hit their highest levels in over a year at 2.1%. (It was the largest single-day jump in yield in 50 years.) Recent worries that the Federal Reserve might scale back stimulus sooner than expected were alleviated when the Bank of Japan and the ECB both reaffirmed their accommodative policies.
The Dow has not yet had a 3-day losing streak this entire year, and we are rapidly closing in on 5-for-5 in positive months this year. Investors were also cheered by May consumer confidence, which was the strongest since February 2008, while home prices accelerated in March by the most in nearly seven years, while prior months were revised upward.
Still, speculation persisted on Wednesday that a tapering of the Fed’s program could be on the horizon. Fed bond holdings have nearly tripled since March 2008, and the combined balance sheets of the Fed, ECB, Bank of Japan, and People’s Bank of China have more than quadrupled over the same timeframe. Thus, the yo-yo resumed.
Rather than holding up during times of weakness, defensive sectors Utilities and Telecom have been taking it on the chin. Wednesday’s 1.5% decline in Utilities brought its loss during May to 9%, and Consumer Staples has now given up all of its May gains. Defensively sectors Consumer Staples, Healthcare, Telecom, and Utilities all ended the day with significant losses.
Indeed, sector rotation into cyclicals continues. Financials, Technology, and Industrial held up well during Wednesday’s selling. Also, Sabrient’s Bear Scores for these sectors have slipped significantly this week. (The Bear Score measures how well an equity holds up during weak market conditions.)
Even with the current rally, P/E multiples remain in line with historical levels. Stock valuations are simply recovering to where they might have been anyway had it not been for the dire global crises of the past several years. And yet there is a distinct lack of bullish euphoria, which means there’s plenty more cash on the sidelines that might serve to fuel more upside in equities, given an attractive catalyst.
Earlier during this relentless uptrend, stocks were driven largely by income-hungry investors fleeing bonds in favor of dividend-paying equities in non-cyclical sectors like Utilities, Consumer Staples, and Telecom. But as valuations in these sectors have risen, market observers like Sabrient chief market strategist David Brown believe that these sectors now should be avoided. It is preferable to look for value in the cyclical sectors. For example, a reasonable strategy is to buy a solid stock with strong market position, sound earnings quality, a reasonable dividend, and an attractive valuation … and perhaps even write front-month calls against the position to target annual returns that can approach 10%.
However, take care to not get caught up in the irrational exuberance of certain investor darlings that have gotten well ahead of themselves despite cutting edge products, sometimes due to nonrecurring items and accounting gimmicks. An example is Tesla Motors (TSLA), as described by Gradient Analytics’ director of research Donn Vickrey.
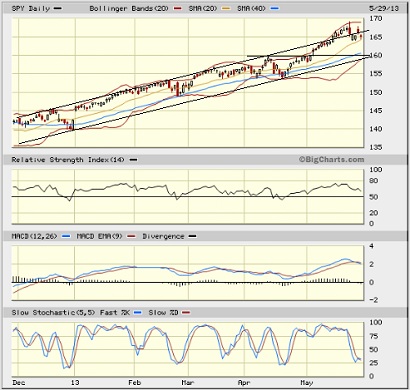
Looking at the chart of the SPY, it closed Wednesday slightly below 165.22 and back inside the bullish rising channel that has been in place since November, Oscillators RSI and MACD are pointing down from severely overbought territory, and price seems to be in the process of a reversion to the mean, while Slow Stochastic has already cycled back down. Price is testing support at the 20-day simple moving average (SMA), and appears to be undergoing further technical consolidation before attempting a concerted breakout.

If you look at a chart dated back to the early-2000 peak, the market has been essentially flat since then, and now appears to be breaking out. Some are calling this breakout from a 13-year “base” an extremely bullish event and the start of a major rally that is not to be missed.
The CBOE Market Volatility Index (VIX), a.k.a. “fear gauge,” closed Wednesday at 14.83, which remains below the important 15 level and supports bullish conviction.
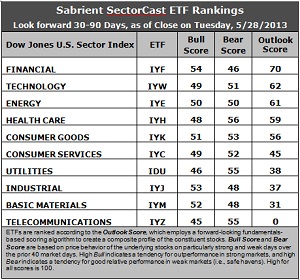
Latest rankings: The table ranks each of the ten U.S. business sector iShares ETFs by Sabrient’s proprietary Outlook Score, which employs a forward-looking, fundamentals-based, quantitative algorithm to create a bottom-up composite profile of the constituent stocks within the ETF. The multi-factor model considers forward valuation, historical earnings trends, earnings growth prospects, the dynamics of Wall Street analysts’ consensus estimates, accounting practices and earnings quality, and various return ratios. In addition, the table also shows Sabrient’s proprietary Bull Score and Bear Score for each ETF.
High Bull score indicates that stocks within the ETF have tended recently toward relative outperformance during particularly strong market periods, while a high Bear score indicates that stocks within the ETF have tended to hold up relatively well during particularly weak market periods. Bull and Bear are backward-looking indicators of recent sentiment trend.
As a group, these three scores can be quite helpful for positioning a portfolio for a given set of anticipated market conditions.

Observations:
1. Financial (IYF) takes the top spot with an Outlook score of 70 this week, while last week’s number one Consumer Goods (IYK) falls all the way to fifth with an 18-point drop to 56. Stocks within IYF display strong sentiment among insiders and Wall Street analysts, as well as a low forward P/E.
2. Telecom (IYZ) stays in the cellar with an Outlook score of 0. It is weak in forward P/E, long-term projected growth, and return ratios. It is joined in the bottom two again this week by Basic Materials (IYM) at 31.
3. This week’s fundamentals-based rankings have taken a noticeably bullish turn, as Energy (IYE) has gained 20 points in its Outlook score, while defensive sectors Consumer Good (IYK) and Utilities (IDU) have fallen.
4. Looking at the Bull scores, IYF has been the leader on particularly strong market days, scoring 54, followed closely by Industrial (IYJ) and Materials (IYM), while defensive sectors have been the laggards. Telecom (IYZ) scores the lowest at 45. This is normal market behavior and further evidence of the rotation into traditional leaders of market rallies. The narrow top-bottom spread of 9 points continues to indicate high sector correlation on strongly bullish days.
5. Looking at the Bear scores, Healthcare (IYH) is now the favorite “safe haven” on weak market days, scoring 56, followed closely by Telecom (IYZ) and perennial favorite Utilities (IDU) at 55, which is quite a bit lower than it has been as investors have abandoned utilities stocks. Financial (IYF) is the worst during extreme market weakness as reflected in its low Bear score of 46. The top-bottom spread has dropped to 10 points, which indicates much lower correlation on weak market days.
6. Overall, Financial (IYF) shows the best all-weather combination of Outlook/Bull/Bear scores. Adding up the three scores gives a total of 170. Telecom (IYM) is the worst at 100. Looking at just the Bull/Bear combination, Consumer Goods (IYK) and Healthcare (IYH) display the highest score of 104. Several sectors share the lowest combo score of 100.
These Outlook scores represent the view that Financial and Technology sectors may be relatively undervalued, while Telecom and Basic Materials sectors may be relatively overvalued based on our 1-3 month forward look.
Some top-ranked stocks within IYF and IYW include Harris Corp (HRS), CACI International (CACI), BlackRock (BLK), and Simon Property Group (SPG).
Disclosure: Author has no positions in stocks or ETFs mentioned.
About SectorCast: Rankings are based on Sabrient’s SectorCast model, which builds a composite profile of each equity ETF based on bottom-up aggregate scoring of the constituent stocks. The Outlook Score employs a fundamentals-based multi-factor approach considering forward valuation, earnings growth prospects, Wall Street analysts’ consensus revisions, accounting practices, and various return ratios. It has tested to be highly predictive for identifying the best (most undervalued) and worst (most overvalued) sectors, with a 1-3 month forward look.
Bull Score and Bear Score are based on the price behavior of the underlying stocks on particularly strong and weak days during the prior 40 market days. They reflect investor sentiment toward the stocks (on a relative basis) as either aggressive plays or safe havens. So, a high Bull score indicates that stocks within the ETF have tended recently toward relative outperformance during particularly strong market periods, while a high Bear score indicates that stocks within the ETF have tended to hold up relatively well during particularly weak market periods.
Thus, ETFs with high Bull scores generally perform better when the market is hot, ETFs with high Bear scores generally perform better when the market is weak, and ETFs with high Outlook scores generally perform well over time in various market conditions.
Of course, each ETF has a unique set of constituent stocks, so the sectors represented will score differently depending upon which set of ETFs is used. For Sector Detector, I use ten iShares ETFs representing the major U.S. business sectors.
About Trading Strategies: There are various ways to trade these rankings. First, you might run a sector rotation strategy in which you buy long the top 2-4 ETFs from SectorCast-ETF, rebalancing either on a fixed schedule (e.g., monthly or quarterly) or when the rankings change significantly. Another alternative is to enhance a position in the SPDR Trust exchange-traded fund (SPY) depending upon your market bias. If you are bullish on the broad market, you can go long the SPY and enhance it with additional long positions in the top-ranked sector ETFs. Conversely, if you are bearish and short (or buy puts on) the SPY, you could also consider shorting the two lowest-ranked sector ETFs to enhance your short bias.
However, if you prefer not to bet on market direction, you could try a market-neutral, long/short trade—that is, go long (or buy call options on) the top-ranked ETFs and short (or buy put options on) the lowest-ranked ETFs. And here’s a more aggressive strategy to consider: You might trade some of the highest and lowest ranked stocks from within those top and bottom-ranked ETFs.


