 Almost there!
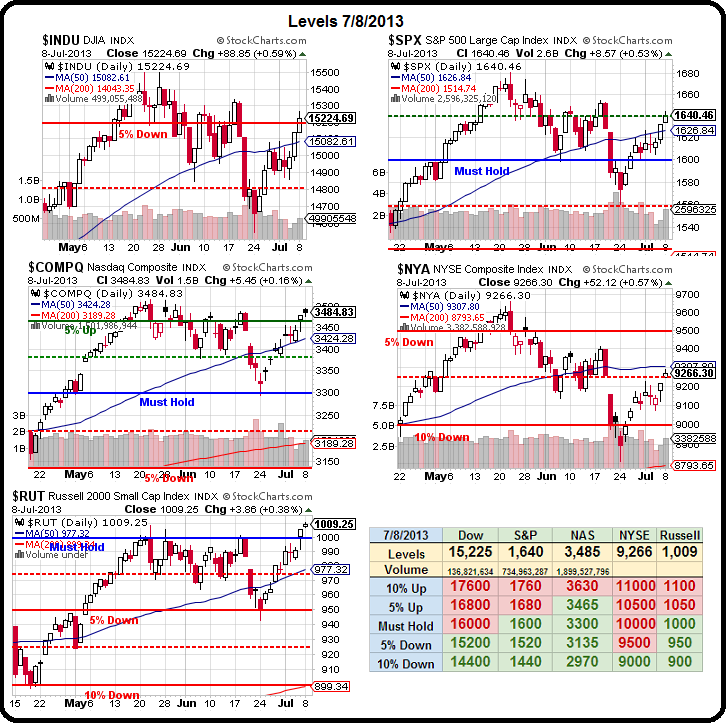
The Russell is making new highs and the Nasdaq is just under it's May 22nd high of 3,532 (1%) the Dow is 2% under 15,542 and the S&P is also 2% under 1,687 but the NYSE is 4.5% below it's May high of 9,695 and still half a point below the 50 dma at 9,307 and, without that, the whole thing could fall apart.
Painful though it may be, we stay bearish on these tests. When we tested these highs in May, we were down almost 10% a month later on the NYSE and over 5% on the others.
Why did the NYSE fall farther and why has it bounced less than the other indexes? That's the key to understanding these markets.
 The problem is that the NYSE is a very broad index, with about 3,000 comanies listed and a Market Cap of roughly $20Tn. The NYSE doesn't have any popular ETFs that track it, as it's too broad, which makes it very hard to manipulate – aside from it's size. For example, while AAPL makes up about 17% of the Nasdaq, it's only 0.5% of the NYSE, which makes it so difficult (ie. expensive) to manipulate the NYSE that even Jamie Dimon would have trouble authorizing the funds.
So, hopefully, the NYSE gives us a clearer picture of the market and we need to take it's lagging performance very seriously but, on the other hand – we cannot ignore the glory that is Russell 1,010 either. The Russell (see Dave Fry's chart) is another broad index of 2,000 small-cap companies (under $2.6Bn, over $130M) and they add up to just $1.9Tn – much easier to push around!
But, faked or no, we have to play the cards we're dealt and this is day two of Russell 1,000+ and now we have 3 of our 5 Must Hold lines green on the Big Chart, which means we need to get more bullish. Both the Dow and the NYSE have a very long way to go to catch up (5%) but, if the rally is real – that shouldn't be a problem for either of them.
 Back on May 21st, we were very skeptical of the rally and that was also a Tuesday, when I titled my post: "2,100 Tuesday – Goldman Gets Sheeple Ready for Slaughter" as that "vernerated" firm targeted 2,100 for the S&P 500 in 2015 and gave us that silly spike on May 22nd.
A major point in my argument that 1,680, let alone 2,100 on the S&P was getting too far ahead of itself as actual earnings estimates (chart on left) had radically diverged from the price of the S&P stocks.
I was right for a month and the S&P dropped from 1,687 to 1,560 (7.5%) on July 24th but now we've come rocketing back in the past two weeks and are testing the 1,640 line, our 2.5% zone over our Must Hold Line using our 5% Rule™. Keep in mind we're still LOWER than where we topped out 8 weeks ago. We do not fear missing a rally – if the rally is real, we'll have lots of time to get bullish. In fact, in that 5/21 post I mentioned using the SPY Dec 2015 $180/200 bull call spread at $5.60 to capitalize on Goldman's call. That position has a 257% upside at S&P 2,000 and now it's $5.35 as the S&P is a bit lower but, if you feel the need to get more bullish – that's a pretty easy way as you can commit 5% of your portfolio to a bullish play and it returns 17.85% (12.85% gain on the WHOLE portfolio) if the S&P is actually over 2,000 in Dec 2015.
 Meanwhile, the REALITY is that stocks aren't really doing that great. Not the broad indexes and especially not cyclical material stocks, which have gone down and down while companies that don't make anything (except promises) are skyrocketing – in an echo of the rally of 1998-99.
Most surprising these past two months, has been the 15% collapse of gold, which followed the 15% collapse it already had prior to May's drop. Officially, for the year, gold is down from $1,650 to $1,250 this year and that's 24%, though from top to bottom it was $1,700 to $1,180, which is 30.5% overall. So, 24% (today at $1,250) is EXACTLY what we call a "weak bounce" and it's another $100 to $1,350 – which is our "strong bounce" target for gold (which we have bullish plays on already).
Keep in mind that we made lower highs (1,654 on the S&P) on June 17th and we didn't like that rally either as that day's article was titled "Monday Manipulated Market Malarkey – Welcome Greater Fools!" and the next day was "Technical Tuesday – Gravity’s Rainbow or Bernanke’s Pot of Gold?" where the message of both of those articles was to take the bullish money and run ahead of what turned out to be a quick 1.5% dip. We thought we'd keep going down and test that 200 dma (S&P 1,525) so the turn at 1,560 caught us by surprise but now it's earnings season – time to put up or shut up for the market!
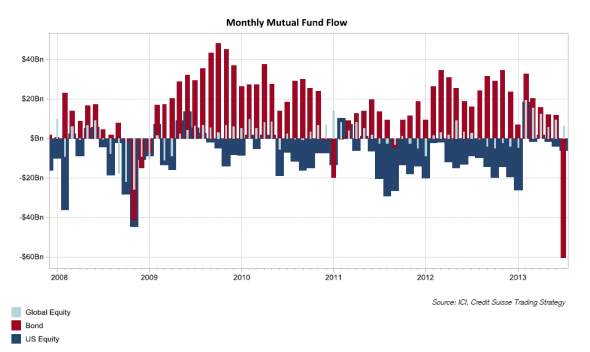
We don't have the Fed Speak (though Draghi was a substitute this weekend) or any IBank upgrades to top us off this week but we do have PLENTY of fuel on the sidelines for a mega-rally as an incredible $60Bn flew out of bonds last month and, one would think, needs to be re-deployed somewhere over the summer. It's up to earnings season to give us a reason to put that cash in play

With this kind of money sitting around, it would be really pathetic if stocks can't garner enough interest to get them to new highs. We'll be watching and waiting – but our action lines are now well-drawn and, today at least, we're still shorting this top.


