 What an exciting index!
On Tuesday, as one of our "5 More Trade Ideas that make 500% in an Up Market", we went long on 16 QQQ Jan $75/80 bull call spreads at $3 ($4,800) and paid for them by selling 2 ISRG 2015 $300 puts for $23.50 ($4,700) for net $100 on the $8,000 spread in our virtual Short-Term Portfolio.
Yesterday morning, however, AAPL decided to take a nose-dive pre-market and, because we were stuck in the spread (as well as long AAPL spreads), I sent out an alert to our Members early in the morning (7:22) to cover with short Nasdaq Futures:
So shorting /NQ at 3,175 is a good way to protect the AAPL longs in the STP. The Nasdaq Futures pay $20 per point so 10 contracts pays $2,000 on a 10-point drop and a tight stop over 3,175 limits the losses.
We hit our $2,000 goal (3,165) at 9:35, just minutes after the market opened, so my first comment to our Members for the morning was:
That's the $2,000 goal on the short /NQ futures and the weekly $495 calls can be bought back for $.40 so done with those in the STP and the $490 calls are $.72 and we'll keep our fingers crossed that we get more of our $2.50 back.
That's how easy it is to use the Futures for quick hedges on your positions when you have market-moving news outside of trading hourse. While we discuss many things at our upcoming Las Vegas seminar, nothing is more important for active traders than learning how to use this valuable tool – the same one that lets us use the energy markets like an ATM!
The best part is, we got out at just the right time, went even longer on the dip and now we're right back on track. As I keep saying to our Members, it's easy to make money in a mindlessly bull market and, since we already hedged for a downturn, we can now get more aggressively bullish. To that end, we added a big long position on AAPL in our beleagured STP and who should join us but my friendbuddypal, Carl Ichan, who liked my trade so much, he went on CNBC and called it a "no brainer."

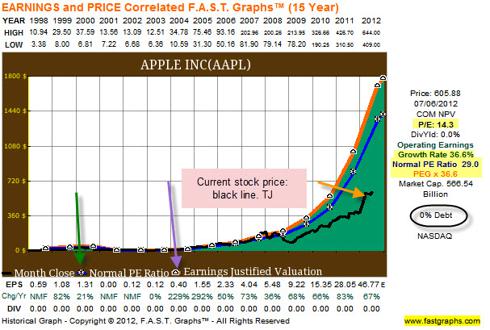
 Carl even pushed my proposal that AAPL just take their $150Bn pile of cash and buy back their own stock. I've said this for ages (since $400) but, even at $467, AAPL has only a $460Bn market cap against $40Bn in CURRENT profits and buying back 1/3 of the company for $150Bn of cash that traders are currently ignoring anyway drops the market cap to $300Bn but has no effect on the $40Bn in sales (p/e of 7.5), not to mention their normal $12Bn dividend would shoot up to 4%.
Hell, I say cut the dividend and borrow $300Bn at 3% and take the whole damned thing private if no one else wants to buy them with a p/e of 7.5! The trading public doesn't DESERVE to own AAPL if they don't think it's worth more than $500 a share. End of rant.

15,000 – 10% is 13,500. 13,500 + 10% is 14,850 and 20% of the 1,350 run is 270 points below 14,850, which is 14,580 – which is, as you can see right where the Nikkei hit resistance that was not futile. It's the same place it failed to take back on the first bounce off 13,500. So way back in July the fate of the Nikkei was already sealed but, of course, we knew that – we were shorting the Hell out of the Nikkei back then!
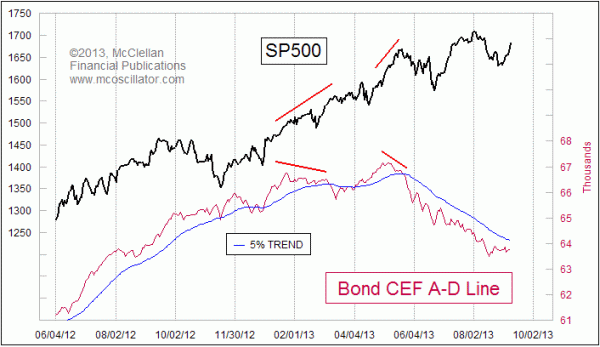
 Back home we're ignoring something that needs to be taken more seriously – a liquidity crisis! As you can see from McClellan's chart on the left, Closed End Bond Funds have been in rapid, steady decline since May. McClellan warns this is a very reliable "canary in the coal mine" stating:
In a period of constrained liquidity, the big cap piggies can still garner their share of the milk, while the runts go hungry. That is why it is useful to watch the health of the bond CEFs and the high-yield bond funds. They are the least deserving of issues, and as long as they are doing okay that means liquidity is not a problem. When they start to suffer, the message is that liquidity is getting tight, and the least deserving of issues are starting to suffer. Eventually such liquidity problems come around to bite the bigger capitalization issues, and that is why this is such an important item to keep watch over.
History shows that the periods when the bond CEF A-D Line is weak are periods when the stock market is in trouble. If there is a stock market dip which is not echoed by the bond CEF A-D Line, usually stock prices recover quickly. But signs of weakness in the bond CEF A-D Line can be a big indication of liquidity problems.
Just something to consider, before we get too irrationally exuberant.


