Courtesy of Rick at Consumer Metrics Institute
At the CMI, we have a unique perspective on the economy. We measure consumer demand on a daily basis, providing nearly two orders of magnitude more resolution than the BEA's GDP releases. This is like moving from naked eye observations to using a lab-grade microscope. As a result we can see timing relationships that simply can't be seen in quarterly data.
Here is our latest report with charts updated as of Dec. 7, 2013.
[For background on the Consumer Metrics Institute's methods for gaining unique insight into the economy, read a 2010 interview with Rick and Ilene here.]
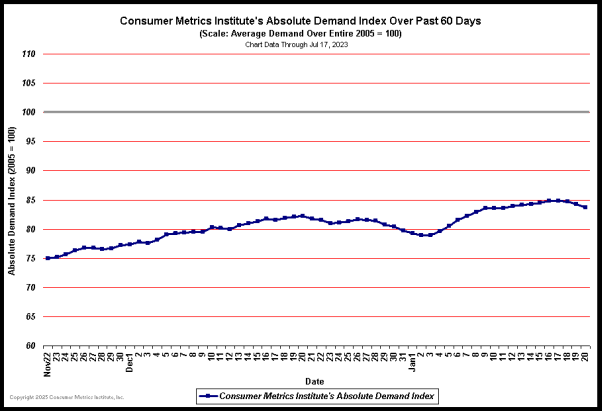
Daily Absolute Demand Index

(Click here for best resolution)
Notes:
(1) A projection of our basic year-over-year data into an aggregate absolute demand, reflecting the compounding impact of extended expansions or contractions. The daily data is normalized such that the year-long average for 2005 would be at 100 in the chart.
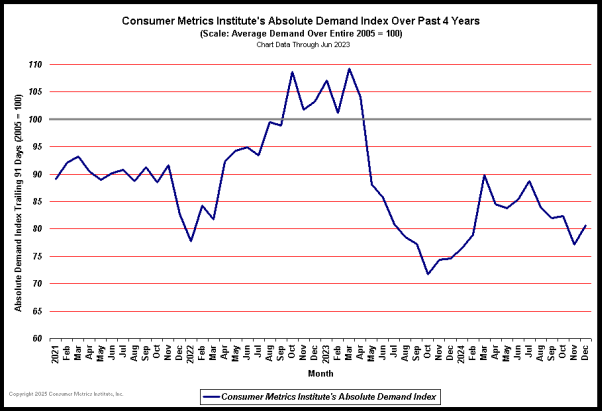
Monthly Absolute Demand Index(3)

(Click here for best resolution)
Notes:
(3) A projection of our basic year-over-year data into an aggregate absolute demand, reflecting the compounding impact of extended expansions or contractions. The data points represent month-long averages of the daily data, normalized so that the year-long average for 2005 would be at 100 in the chart.
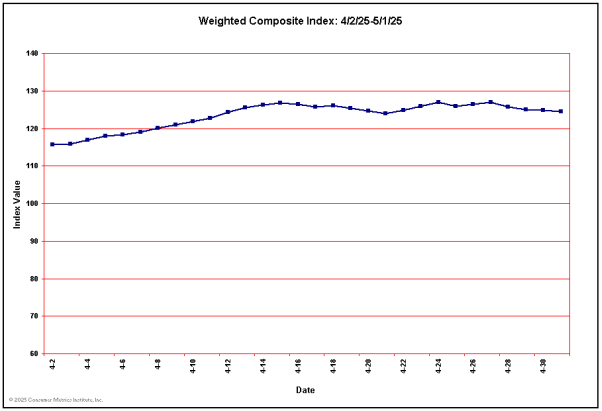
Current Weighted Composite & Sector Index Values

(Click here for best resolution)

Current Growth Index Values & Percentiles:

(BEA's GDP growth tables here.)
Commentary
December 5, 2013 – BEA Revises 3rd Quarter 2013 GDP Growth Sharply Upward to 3.60% Annual Rate:
In their second estimate of the US GDP for the third quarter of 2013, the Bureau of Economic Analysis (BEA) reported that the economy was growing at a 3.60% annualized rate, up a surprising 0.76% from the 2.84% growth rate previously reported for the quarter. The improvement in the headline growth number came principally from growing inventories (now contributing 1.68% to the headline, up 0.85% from the earlier report) and fixed investment (adding another 0.81% to the headline, an increase of 0.18% from the prior report). The contribution from consumers was reported to be weakening slightly, as were exports. Increasing imports also lowered the headline number somewhat (removing -0.43% from the headline, a change of -0.13 from last month's estimate). And the BEA's own "bottom line" growth rate for the economy (the "real final sales of domestic product") weakened to a 1.92% annualized growth rate.
For this report the BEA assumed annualized net aggregate inflation of 1.96%. This deflator is reasonably close to those recorded by its sister agencies within the US Government. During the third quarter (i.e., from June to September) the seasonally adjusted CPI-U index published by the Bureau of Labor Statistics (BLS) rose by 1.73% (annualized), and the price index published by the Billion Prices Project (BPP) rose at an annualized rate of 1.72%. As a reminder: an overstatement of assumed inflation decreases the reported headline number — and in this case the BEA's "deflator" slightly lowered the published headline rate. If the CPI-U had been used to convert the "nominal" GDP numbers into "real" numbers, the reported headline growth rate would have been a somewhat higher +3.90%, while using the BPP index (which arguably best reflects the experiences of the American consumer) would have generated an even higher +3.92% annualized rate.
Finally, real annualized per capita disposable income was now reported to have risen by $196 per year and the personal savings rate increased to 5.0% (from 4.7% reported earlier). That savings rate had taken a 2.5% hit (a 38% reduction in the savings rate) during the first quarter as households struggled to absorb the 2% increase in FICA tax rates. The savings rate has now recovered more than a third of those first quarter cutbacks — with the funding of those savings coming mostly through weaker growth in household expenditures.
Among the notable items in the report:
— The contribution of consumer expenditures for goods to the headline number decreased to 0.93% (down from 0.99% in the prior report).
— The contribution made by consumer services dropped to 0.02% (down slightly from 0.05% previously reported, but off sharply from 0.53% in the prior quarter). Growth in the consumer services sector has clearly stagnated.
— The growth rate contribution from private fixed investments strengthened to 0.81% (up from the 0.63% previously reported, but still down from 0.96% in the prior quarter).
— Inventories were shown as growing much faster than previously thought, and they are now contributing +1.68% to the headline growth rate (more than four times the +0.41% contribution during the prior quarter).
— A growth in net governmental expenditures added 0.09% to the headline number, with that growth occurring exclusively at state and local levels.
— Exports contributed 0.50% to the overall growth rate, down slightly from the 0.60% previously reported — and down materially from the 1.04% reported for the second quarter.
— And imports now subtracted -0.43% from the headline number (compared to -1.10% during the prior quarter).
— The annualized growth rate for the "real final sales of domestic product" decreased again to 1.92% (down from 2.07% in the previous quarter). This is the BEA's "bottom line" measurement of the economy — which remains substantially weaker than the headline number because of the ongoing buildup of inventories.
— And as mentioned above, real per-capita disposable income improved slightly and it is now reported to have increased by an annualized $196 from quarter to quarter. But that number is still down $321 per year relative to the fourth quarter of 2012 (before the FICA rates normalized).

The quarter-to-quarter changes in the contributions that various components make to the overall GDP can be best understood from the table below, which breaks out the component contributions in more detail and over time. In the table below we have split the "C" component into goods and services, split the "I" component into fixed investment and inventories, separated exports from imports, added a line for the BEA's "Real Final Sales of Domestic Product" and listed the quarters in columns with the most current to the left:

Last month we mentioned that the BEA's earlier first estimate for 3Q-2013 (a 2.84% headline) was a "Goldilocks" moment: not so weak as to elicit real concern, and not so strong as to suggest the Federal Reserve re-thinking its QE stance. But at face value the new headline growth rate of 3.60% has arguably moved out of that "Goldilocks" zone — and if the Fed was looking for "cover" for tapering, a growth rate above 3.5% would certainly qualify. In fact, under normal circumstances a 3.60% growth rate would indicate a healthy economy and be sufficient cause to start dismantling an extended "Zero Interest Rate Policy" (ZIRP). But these are not normal circumstances:
— Nearly half of the headline number came from growing inventories. Conventional wisdom has this component reversing itself in future quarters — reverting to a long term net zero gain or loss. In fact, since 2006 the average annualized real contribution from inventories has been essentially zero (-0.02%). Bloated inventories have a tendency to normalize, and in coming quarters we can expect production cuts to accomplish just that. If during the next quarter the inventory number reversed while everything else stayed the same, the headline number would be less than 0.25%.
— Employment numbers still provide no "cover" for Fed tapering or tightening.
— Contributions to the headline number from consumer spending on goods, consumer spending on services and exports all weakened.
— Real per capita disposable income is still down -0.86% year-to-date. And if households continue to normalize their savings rates over the next few quarters (just as they have over the past two quarters while attempting to move back towards the savings level "comfort zone" seen prior to the January FICA increase), those increased savings will have to come from reduced spending.
In theory the employment numbers and disposable income tell us how households are doing. Those numbers alone tell us that households are not doing well, and the consumer spending numbers just released by the BEA confirm that households are adjusting accordingly. And the BEA's average real per capita disposable income somewhat masks any impact from a shifting distribution of that disposable income among households — i.e., the median year-to-date real per capita disposable income is almost certainly down more than the one percent shown in the average.
Unfortunately the inventory surge gives a "smoke and mirrors" feel to this report. Even the BEA's own bottom-line "Real Final Sales of Domestic Product" indicates that real growth is less than 2%. But we're guessing that Mr. Bernanke and his colleagues know that — giving QE and ZIRP yet another lease on life.


