At Market Shadows, we have been long-term bullish since we began our Virtual Value Portfolio in October of 2012. Our overall view of the market is based on factors that Lee writes about in the Wall Street Examiner Professional Edition Fed and Treasury Update, an invaluable guide to understanding the investing environment.
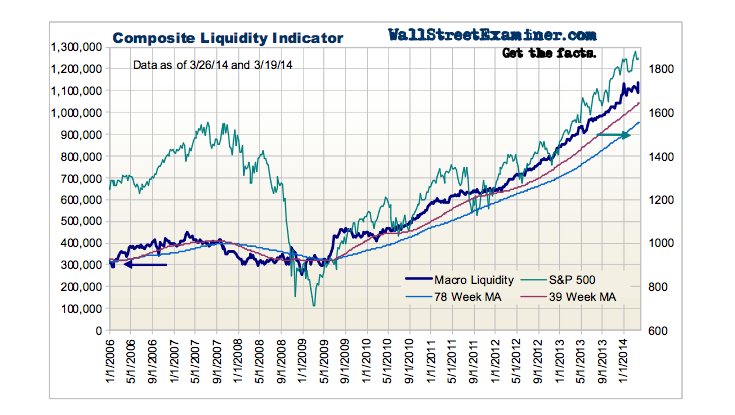
Lee's Composite Liquidity Indicator (CLI) is a measure of the liquidity in the the market and is comprised of important liquidity sources, including components such as Fed Cash to Primary Dealers, Foreign Central Bank Purchases and US Commercial Bank Deposit Flows. Lee provides updated charts of these factors in the Wall Street Examiner's Prof. Edition Fed and Treasury Update.
While the CLI is rising, it is difficult to see stocks declining significantly. For long-term investors, the CLI, and factors built into it, are probably the best indicators to watch to avoid being heavily invested through another plunge in the stock market. Not understanding these market forces is a recipe for disaster.
Below are excerpts from Lee's Professional Edition Fed and Treasury Update – Wednesday, April 02, 2014.
Fed's Next Blunder Is Baked In, But Madness Will Continue Until Then
Courtesy of Lee Adler of the Wall Street Examiner
Another week. Another new high in the composite liquidity indicator. Stock prices tagged along, just as they have throughout the 5 years of Fed money printing madness. The liquidity trend remains strongly upward, in spite of Tapers One and Too, which now have the combined effect of reducing the flow of cash into Primary Dealer accounts by $20 billion per month. Taper III will begin taking another $10 billion off starting now.
That may sound like a lot, but the dealers will still be getting around $70 billion a month from the Fed’s POMO purchases. Add to that the cash flowing into dealer accounts from the BoJ, and the rumblings that China is relenting on its tighter monetary policy, and that’s still a garishly tilted playing field.
Composite Liquidity Indicator

3/14/14 This indicator will keep trending upward. If stock prices correct and the liquidity indicator’s trend continues to rise to new highs, that should once again support another rally to new highs.
3/25/14 In this week’s broken record report, the Fed and BoJ money printing operations along with capital flight out of troubled regions of the world into the US continue to keep both the US Treasury market and stocks levitated at what appears to be a “permanently high plateau.”
The problem I have with that is that as the Fed and BoJ continue to print money and turn it over to the Primary Dealers, the pressure on these accounts to redeploy cash will rise, leading to stocks blowing off yet again. My hunch is that only a complete meltdown in China could change that, and recent stories out of China suggest that the authorities there are getting nervous about the weaker economy. If they relent from their tight policy of the past year, the only source of downward pressure on worldwide liquidity would abate, only exacerbating conditions conducive to yet another upside blowoff in the US equity bubble.
Something needs to happen to force the central banks to stop the madness. I don’t know what that will be, and it seems pointless to speculate about it. A dangerous trend will develop that should begin to make it clear that the Fed will need to reverse course. History tells us that the Fed will be behind the curve. By the time they recognize the problem, it will be too late and the markets will spin out of control. We’re not there, but we’re getting close, as stock prices bubble off into the stratosphere.
Macroliquidity Component Indicators
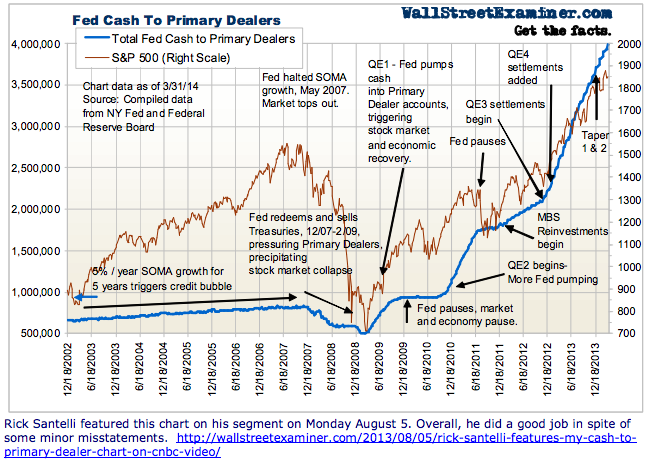
Fed Cash to Primary Dealers The latest $10 billion announced taper of QE will take effect this week. That might make a small difference, but probably not until May, with the market being flush with cash from Treasury paydowns in April (see Treasury update). Meanwhile the scale on the left side of this chart continues to shrink as the cash flows to Primary Dealers from the Fed stay pinned to the top of the chart. The slower rate of purchases as the Fed tapers is hardly discernible.

Rick Santelli's video is here.
Get regular updates on the machinations of the Fed, Treasury, Primary Dealers and foreign central banks in the US market, in the Fed Report in the Professional Edition, Money Liquidity, and Real Estate Package. Click this link to try WSE's Professional Edition risk free for 30 days!
Copyright © 2012 The Wall Street Examiner. All Rights Reserved.


