 Things are still looking up.
This morning, Japan revised their Q1 GDP Estimate from 5.9% to 6.7% as a huge splurge in consumption ahead of the sales tax increase shot Consumer Spending through the roof 3-6 months ago. It's a great indication of what insane amounts of stimulus can do (Japan is puming about 10% of their GDP into the economy vs. "just" 5% in the US and less than 2% in Europe). By contrast, Europe's GDP grew just 1% in that 18-country block and the US was down 0.1% during the same period.
Clearly stimulus works – so – the answer to everything is – MORE STIMULUS!!!
More stimulus, more stimulus and, when in doubt (or, when needing to hit your numbers) – even more stimulus! We saw the ECB get on that bandwagon last week and our Fed never stopped so, what can possibly go wrong in a global money-printing party. Other than this, of course (projections for Q2 in Japan):

Even Japanese traders wised up this morning as the Nikkei tumbled off the high of 15,235 back to 15,160 in the Futures (/NKD) but that's still high enough to give it an official 0.3% gain for the day. Other Asian indexes also sold off into the close, but not so much as to not print another bullish Monday as Chinese export growth (May) came in strong as well at 7%, after a very weak 0.9% in April.
This is what happens in a market that ignores bad news (the 0.9% disaster didn't take us down) and celebrates good news – there's literally nowhere to go but up! MSCI's All-World share index (.MIWD00000PUS on Bloomberg), which encompasses 45 countries and is generally seen as benchmark of global stocks, was up 0.1 percent at 426.77 points, just below its 2007 pre-financial crisis peak of 428.63 points.

This chart is interesting as it gives us a view of both p/e, which has been boosted by stock buybacks and M&A activity, as well as price to sales, which isn't. The capacity for both investors and analysts (not Dr. Ed) to ignore this kind of information astounds me, as clearly we can see that we are now looking WORSE than we did in 2007, the last time stock buybacks and M&A were used to artificially boost the APPARENT p/e of so many stocks – to mask the fact that we were, in fact, heading into a crisis of biblical proportions. As Dr. Ed notes:
Many years ago, Professor James Tobin of Yale (and the chairman of my PhD committee) devised his Q Ratio, which is the total market value of a firm divided by the replacement cost of building the firm from scratch. When Q exceeds 1.00, entrepreneurs have an incentive to build it because its market value will exceed its cost.
That’s obviously a very theoretical construct used to explain the capital spending cycle. Nevertheless, the Fed’s Flow of Funds database includes two series that can be used to derive a Q ratio for the overall market showing the extent to which investors are either overvaluing or undervaluing the capital stock. I adjust it so that it has equaled 1.00 on average since the start of the data in 1952. During Q1, it rose to 1.56, the highest since Q4-2000.
But Q1 of 2000 was DOWN from the highs we hit in 1999 so perhaps this market madness has another rally leg to play out before correcting (and hopefully not 50% down to the mean line). That's the problem with being a Fundamentalist – we tend to lose interest in buying stocks long before they finally top out.
 Of course, we're still able to find values – even in a crazy, over-bought market. This weekend I put up a Buy List for our Members with 29 stock and option trade ideas for playing them.
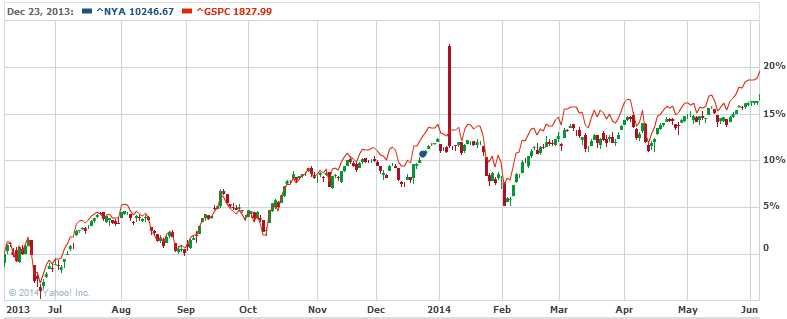
My plan is to be PATIENT and add a few to our Long-Term Portfolio, which now has $608,000 in virtual cash to deploy, up from our $500,000 base (+19%) in December. As you can see from the opening dates of positions from the first half, slow and steady won that race – so no need to change strategies here – especially when we're concerned the market may pull back.
 IF the market does pull back, we'll be thrilled to jump in and start buying but, for now, we remain "Cashy and Cautious" because we're keenly aware that the GDP numbers have been manipulated (entertainment was added in the US, hookers and drugs in Europe, real estate stopped depreciating in China…) and we KNOW the Corporate Profits are manipulated and we KNOW that Consumer Spending is off AND the Consumers are leveraging debt just to keep up these lower levels.
Richard Green pointed out in Forbes last week that the top 1% are skewing our basic economic measurements, like the Case-Schiller Housing Index, since it's value-weighted so million-Dollar homes have 5x more impact on the index than $200,000 homes. His example is:
Suppose that two houses sell in 2013 and 2014. The first sells for $200,000 in both years; the second sells for $1,000,000 in the first year and $1,500,000 in the second year. If we were using a transaction weighted index, the average prince increase would be 25 percent (0 percent for the first house and 50 percent for the second). But with a value weighted index, we put together a “portfolio” of houses and see that the total value increased from $1,200,000 to $1,700,000, or a shade under 42 percent.
That's why, the "Low Tier" Case-Shiller Index (homes under $300,000) still shows housing prices for the bottom 80% still 30% off their highs.

As Fundamental Investors, when we are presented with unreliable or manipulated data, our preference is to stay out of the market until we have some clarity. That doesn't mean we don't play at all – we are very able to amuse ourselves while we wait for more information (like July earnings). Last Monday, for example, I sent out an Alert to our Members to buy TNA (ultra-long Russell) July $76.81 calls for $1.60, adding 20 contracts to our $100,000 Short-Term Portfolio for $3,200 (and I also mentioned them in Tuesday morning's post – available daily, pre-market, by subscribing here).
 The idea was to have a nice upside trade that would make a bit of money, in case we were too bearish. We took 50% gains off the table ($1,600) on Thursday but the rally continued on Friday and those calls finished the week at $4, which is $8,000 for 20 or a gain of $4,800 (150%) for the week.
That's how crazy this market is, you can use just $3,200 in cash and end up boosting a $100,000 portfolio 5% in a week! This is how the Fed is handing out FREE MONEY to those of us in the top 1%. If you can afford to play this game, you too can make 5% a week on your money. We could have been more aggressive but we actually flipped bearish and picked up the TZA (ultra-short Russell) June $17 calls for 0.27, betting $1,350 (less than our profits from last week) on a reversal into options expirations in two weeks.
On Friday morning, at 10:09, we called the move for the day in our Member Chat Room, saying:
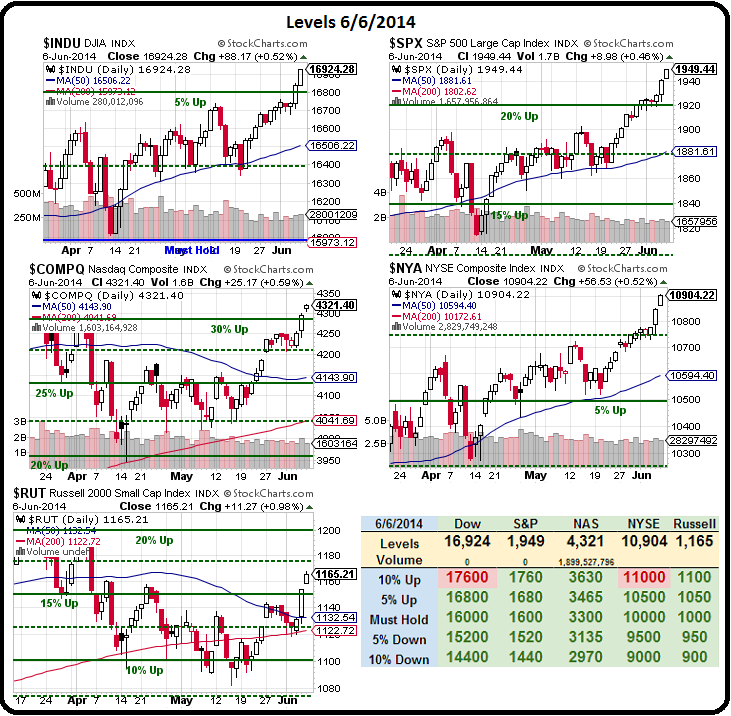
Even if we call 1,900 the breakout on /ES, we're completing a 2.5% move at 1,947.50. BUT, the real consolidation point, per the 5% Rule, is 1,920 (the 20% line) and a 20% overshoot of that 320-point move (from 1,600) would be +64 to 1,984 with 1,942 a 10% overshoot.
The NYSE is still under the 10% line (11,000) by about 1% and I don't see the S&P holding a 10% advantage for long, they don't usually diverge by that much and it's the S&P that usually corrects back (always on this chart):

MAYBE this time is different but I'm pressing my Dow shorts (/YM) at 16,900 into the weekend.
Both indexes finished the day just over our targets, with the S&P at 1,949 and the Dow Futures (/YM) at 16,924.

It sure doesn't look like a chart you want to be shorting and, overall we're not short – just in cash and, for the moment, missing the rally.
We have a live Webinar Tuesday at 1pm (EST) and, if the markets aren't pulling back by then, we're going to get at least one foot on the bandwagon and add a few positions from our Buy List. We hear from Bullard, Tarullo and Rosengren from the Fed today and there's not much market data this week but it's next week we think will be interesting.
Meanwhile – PATIENCE!


