Courtesy of ZeroHedge. View original post here.
Submitted by Tyler Durden.
Larry Fink told the world this morning that central banks are holding a floor under stock prices (but wouldn't expect to see large price increases) – and judging by the gamma imbalances in volatility-land, they are using options markets to unriggedly manage that implicit put. However, given the utter dominance of the machines in the market and any reaction when real volume hits stocks (always down), we thought, courtesy of Nanex, a gentle reminder of just how quickly the Fed put disappears would be useful in this new "we can never get hurt, valuations are within norms, there is no complacency" normal.
This is a supplemental update to (a must read report): Reexamining HFT's Role in The Flash Crash.
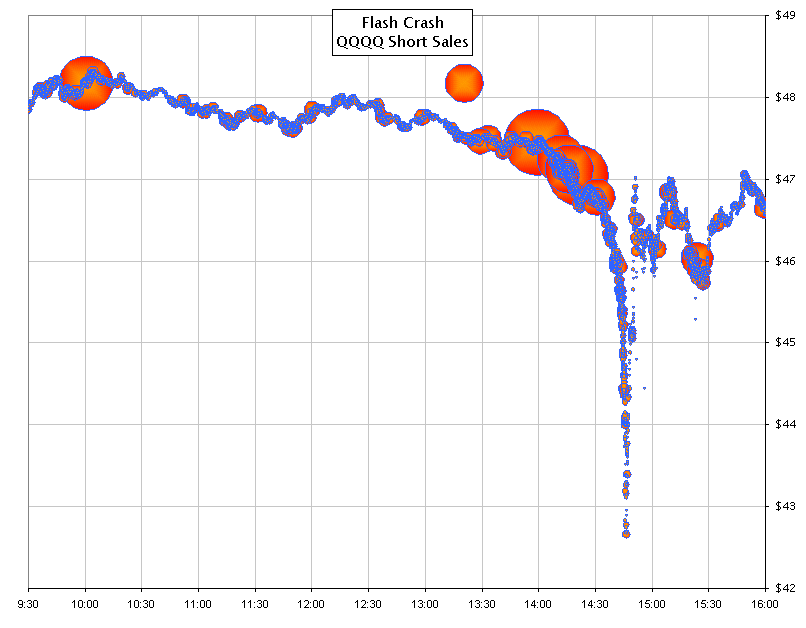
Plotting short sale data (Reg SHO) for trades executed on the day of the flash crash, we found several surprises.
1. There were large short sales in QQQQ during the hour preceding the crash. This is the Nasdaq 100 ETF (the symbol later changed to QQQ).
Each circle represents a short sale in QQQQ, sized by the number of shares in that trade.

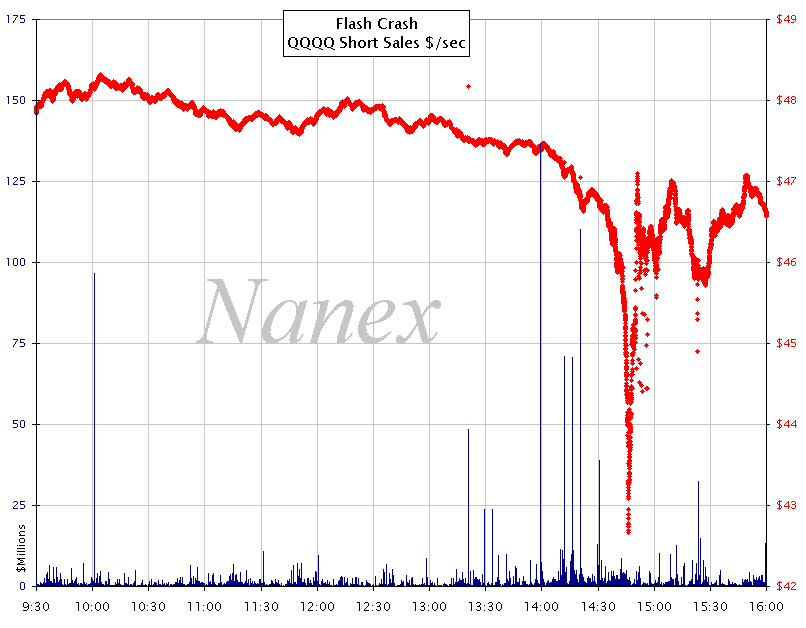
2. Another view of the data in Chart 1 above, but includes a histogram (blue) showing the total dollar value of short sales in QQQQ for each second.
Many seconds show $25 million or more of QQQQ shorted, with two seconds showing over $100 million. Most of these occur shortly before, but not during the time the Waddell & Reed Algo was active (14:32 – 14:53). Curious that no mention of this was made in the SEC flash crash report.

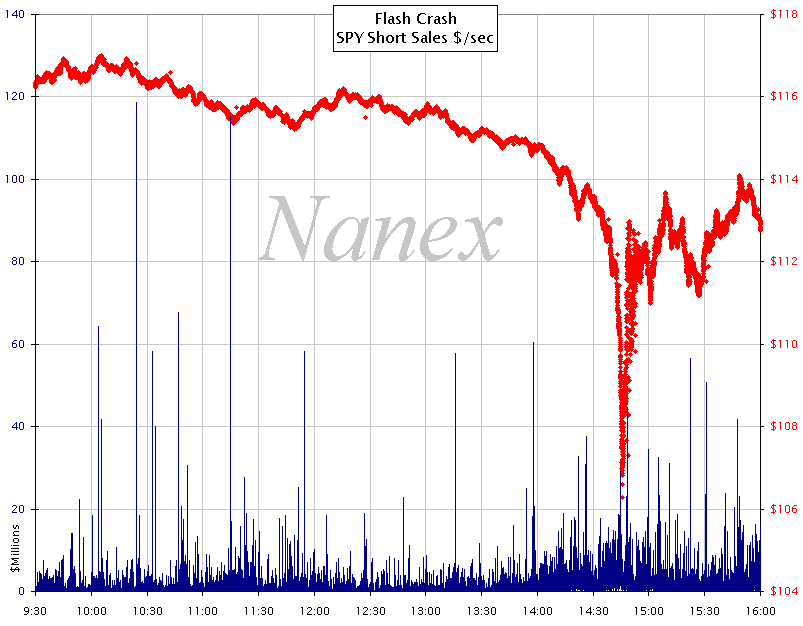
3. SPY also had many seconds with high short sales, but not as stark as QQQQ.

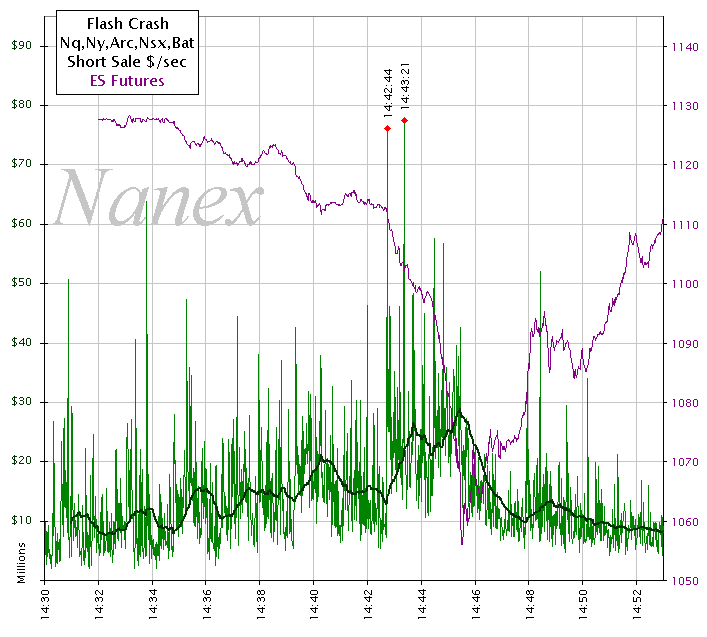
4. Total value of short sales each second for NMS stocks between 14:30 and 14:52 along with prices for the eMini (ES) futures contract for reference.
Note that 14:42:44 stands out as one of the peak seconds – a point we previously identified as the very beginning of the flash crash.


