

Chart o’ the Day: S&P 500 on the 50-Day
Courtesy of Joshua M Brown
The larger uptrend for the S&P 500, as defined by the popular 200-day moving average, remains intact. Shorter-term oriented players and strategies will be focused on the 50-day, however, which is in play this afternoon.
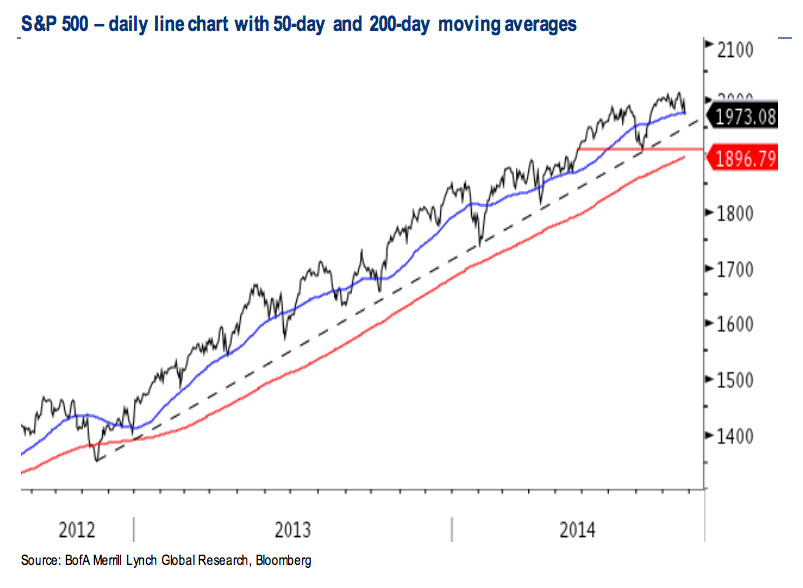
The S&P 500 has broken below the 50-day moving average on a few occasions this past year and it hasn’t mattered. In fact, each of these breaches turned out to have been a pivot point for a bounce to new record highs. Stephen Suttmeier, ace technician at Bank of America Merrill Lynch, illustrates this below.
The blue line represents the 50-day, red is 200, the black doted line is the key trendline going back to 2012’s liftoff moment.
Source:
S&P 500 pressing key support
Bank of America Merrill Lynch – September 25th 2014