

Will the Top-Callers Get Clowned Again?
 Courtesy of Joshua M Brown
The S&P 500 finished the first month of the year with a 3.2% loss.
By this time last year – the first trading day of February – the S&P 500 had declined by 6% in the first month of 2014 and the top-callers were out in force. Except the market bottomed that day and recovered the entirety of the correction within 4 weeks, shocking everyone who had raced to the sidelines with a massive V-shaped sprint to new all-time highs.
I don’t suggest that another V is in store for us as I have no ability to see things like that coming in advance (nor do you). I just find it helpful to keep in mind the fact that anything’s possible – even that which looks most unlikely.
The current narrative is that the world is once again falling apart, amidst the renewed possibility of Grexit and the seemingly daily beheadings we’re hearing about in the normally tranquil Middle East. Earnings growth for this year is at risk because of a ripping risk-off trade in dollars and the crash of crude oil.
That’s a fine narrative – except for the fact that crude has rebounded by 10% in the last few days and S&P 500 earnings are now tracking ahead of expectations, with 37% of companies beating on both the top and bottom line (better than the historic average of 35%). Meanwhile, while companies are increasingly citing the headwinds of currency swings and the dollar’s strength, the multi-nationals are actually managing just fine. BofA’s Savita Subramanian says “58% of companies with high overseas exposure have beaten on EPS, vs. 46% of the pure domestics” with the first three weeks of earnings in the can.
Narratives can be tricky when the facts change even though the story is still so much fun to tell.
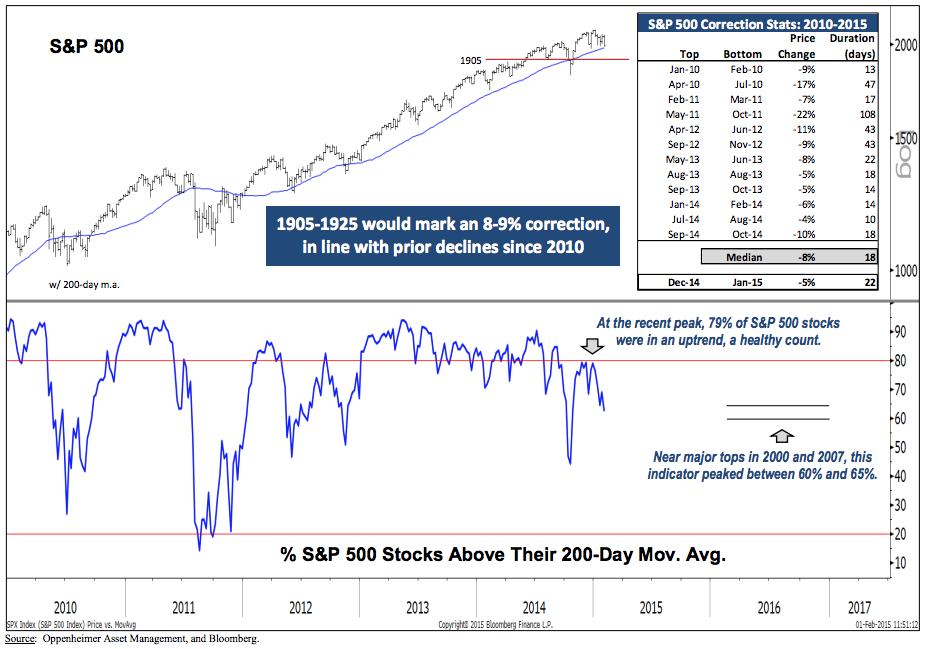
Ari Wald, Oppenheimer Asset Management’s ace technician, has this to say about the recent 5% pullback:
The S&P 500 is down 5% over a 22-day period vs. a median decline of 8% over 18 days since 2010. An 8-9% decline from the index’s December peak points to the 1905-1925 range, if 1970 support fails to hold. We believe the correction is closer to its end than its start because a “stealth bear” for smallcaps has already been weathered and European equities are breaking out to the upside as well; we think this decreases the risk of a correlated rollover. In addition, 79% of S&P 500 stocks were above their 200-day m.a. at the index’s December peak, a bullish count implying that the current decline is healthy consolidation helping to relieve overbought conditions. At major tops in 2000 and 2007, this indicator peaked between 60% and 65%.
And his chart illustrating these points is here:
Source:
Inflation Points: Correction Closer to Its End than Its Start
Oppenheimer Asset Management – February 2nd 2015