Courtesy of Joshua M. Brown
Bank of America Merrill Lynch’s ace technician Stephen Suttmeier is out with his big monthly chart book this weekend and he leads off with a pair worthy of our attention.
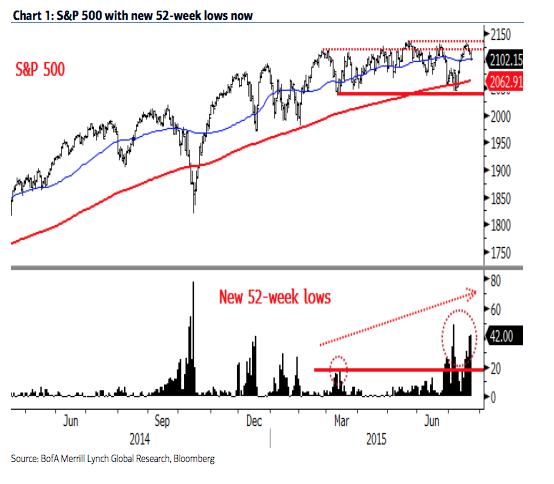
The number of S&P 500 52-week lows that have piled up here at the midpoint of 2015 is not a good thing. The market has been able to shrug off lots of internal breadth problems over the last few years, but this could be a big enough problem to do permanent damage to the advance. The major average has now been stalling for over half a year while the constituent stocks have been dropping to new year-lows one by one.
The tally now stands at 42 and counting. It’s not easy to make a meaningful new high in the index when 10% of the companies included are dropping precipitously.
Suttmeier notes later on that a lot of the weakness is concentrated in energy, materials and industrials – which is understandable given the commodities / emerging markets picture this days. On the side of the bulls is the fact that financials are building in strength relative to the overall S&P 500.
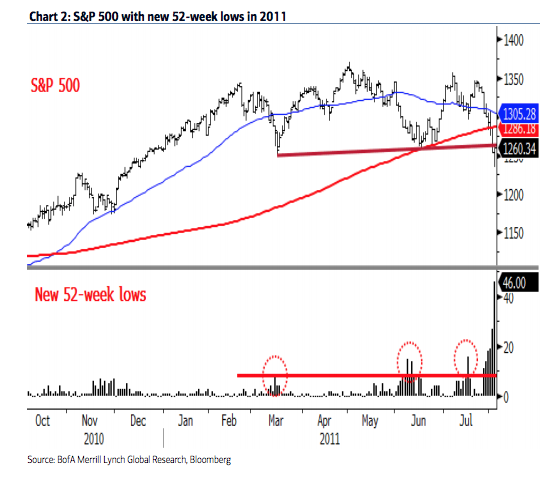
The 2011 comparison is an interesting one…
Chart 1: Expansion in 52-week lows is big breadth concern for the S&P 500 The expansion in the number of S&P 500 stocks hitting new 52-week lows as the S&P 500 has traded within its range from late February is a warning from market breadth and suggests that 2120-2135 resistance should hold. Key support for the S&P 500 remains 2040, but diminishing breadth is a risk for this support.
Chart 2: This increase in new 52-week lows is similar to summer 2011 The mid 2015 build-up of new 52-week lows within the S&P 500 is similar to the mid-2011 increase in new 52-week lows. The 2011 build-up in new 52-week lows preceded a breakdown from a top in the S&P 500 and a peak to trough decline of 19.4% on a daily closing basis (21.6% on an intra-day basis) into October 2011. Difference is that over 40 stocks in the S&P 500 have hit new 52-week lows now vs. under 20 prior to the August 2011 S&P 500 breakdown, meaning that the setup might be more bearish now than in 2011.

Source:
Monthly Chart Portfolio of Global Markets: S&P 500 cyclical bull market at risk
Bank of America Merrill Lynch – July 24th 2015


