Courtesy of Dana Lyons
Everyone knows that spikes in the S&P 500 Volatility Index, a.k.a. “VIX”, are associated with distress in the equity markets. The recent August decline in stocks was a perfect example of this as the VIX jumped from near 11 to over 50 in just a few weeks with the S&P 500 dropping by more than 10%. As stocks have recovered, the VIX has calmed down. As of Monday, the VIX closed below 20 for the first time since the middle of August. Such returns to “normalcy” in the VIX have typically been associated with a return to calmer times in the equity market. This recent round trip in the VIX got us wondering how reliable of an all-clear signal that has been for stocks historically. So…surprise, we checked it out.
We originally searched for all occasions in which the VIX first returned to below 20 after having spiked above 40. Upon looking, however, we noticed that there were a few near-misses that would be interesting if included. Therefore, we adjusted our search for spikes above 37. Yes, this is pure data-mining, and we pride ourselves on avoiding such gimmicks. After all, our ultimate goal is to make our clients more money. Thus, mining for trivial data points is a waste of our time. This study certainly falls into that trap, however, we think the results are interesting enough to publish – and may serve a valuable lesson too.
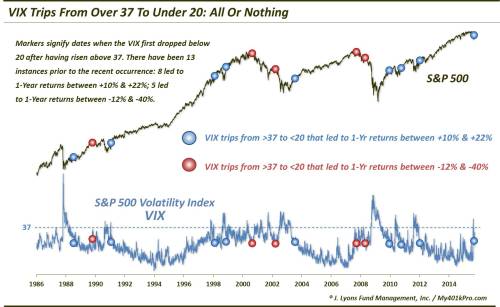
As it turns out, since the inception of the VIX in 1986, there had been 13 occasions (before the recent one) in which the VIX climbed over 37 before dropping back below 20.

So what was so interesting about these VIX trips from over 37 to under 20? The most interesting thing is that this signal was not at all a consistent harbinger of calmer, happier times for stocks. In fact, in the longer-term, i.e., 1-year out, this signal was the opposite of consistent. The results were binary. They were like Babe Ruth’s batting output: a home run or a strike out, all or none.
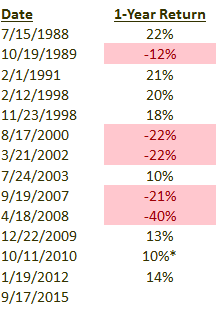
Of the 13 prior signals, 8 led to 1-year gains between +10% and +22%. The other 5 resulted in 1-year losses of between -12% and -40%. Here are the dates along with their 1-year returns:

(We took a little liberty in the 10/11/2010 event. The actual 1-year return was +3%, as of 10/11/2011 when the market was just emerging from the steep correction. Just 1 week later, however, the return had risen to +10%.)
So what gives? The difference between the two outcome regimes lies in the transition of market structure. Those events seeing positive 1-year returns were emblematic of the customary environment in which a drop in the VIX to lower levels signals a more placid climate, conducive to stock market gains. In other words, a VIX drop below 20 is akin to crossing the threshold into “home run” territory for stocks.
On the other hand, the events that led to 1-year losses occurred concurrently with a shift in market structure from a low-volatility environment to one of elevated volatility. In these cases, the initial spikes above 37 were not merely temporary dislocations. They were warning shots that ushered in this new high-volatility environment. In these kinds of environments, drops below 20 do not signify a threshold crossing. More accurately, they signal an “oversold” status, or the lower bound of the elevated volatility climate.
So how do we know if the current signal is a “threshold crossing” into a better climate for stocks, or the lower bound of a new climate of elevated volatility? One possible clue may come in the behavior of the VIX going forward. Following the 5 events that saw the market lower 1 year out, the lowest the VIX was able to reach was the upper-15′s. This may be a level to keep an eye on as a significant breach may be a clue that the favorable low-volatility environment isn’t dead yet.
We cannot know for sure at this point if a volatility shift has occurred. We do have our reasons to be suspect of stocks in the longer-term, but not based on this data. Perhaps the best takeaway from this study is that a drop in the VIX below the 20 level is not an automatic all-clear sign for stocks. Similar moves have, on several occasions, marked the lower bound of a new high-volatility environment.
In other words, stocks are not an automatic home run here. A year from now, it is entirely possible that stocks will have struck out.
* * *
More from Dana Lyons, JLFMI and My401kPro.


