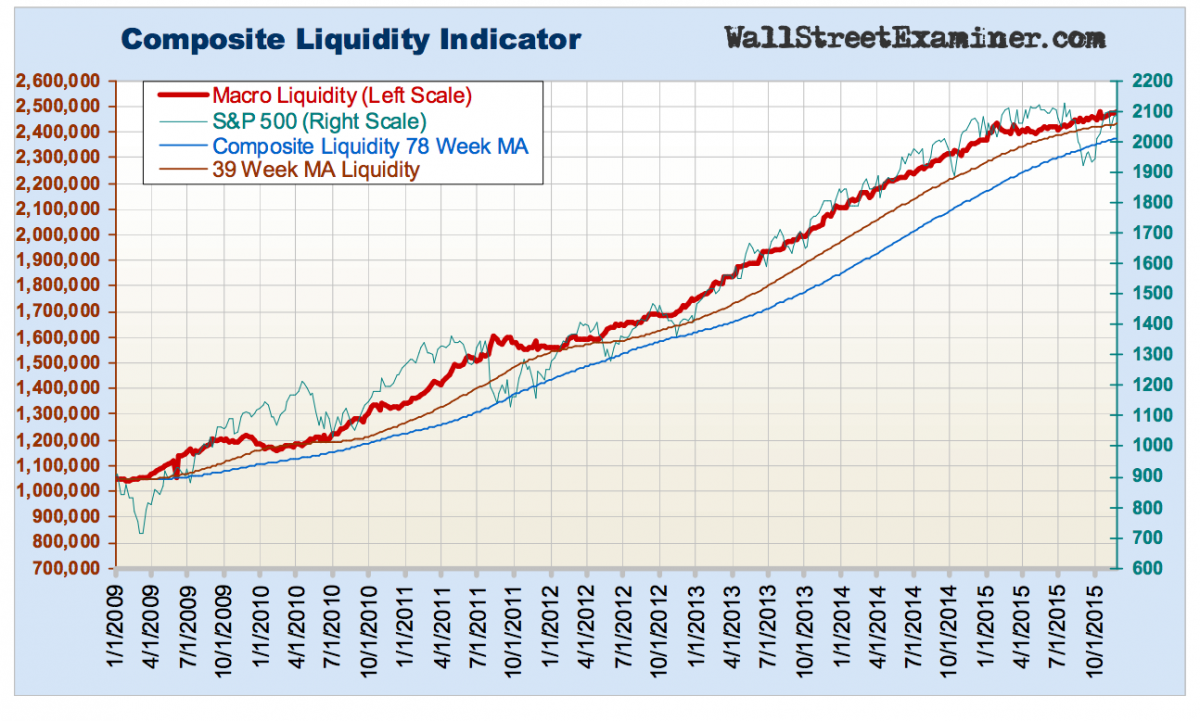
Lee Adler of Wall Street Examiner shows that the stock market continues to parallel his Composite Liquidity Indicator, with both the S&P and the liquidity indicator moving higher.
Here is Lee's Composite Liquidity Indicator and the S&P:

Lee writes,
Macroliquidity increased slightly last week. The trend is still positive, although at a much shallower angle than during the years when the Fed was doing QE. The growth rate this year has only been around 2%.
[…]
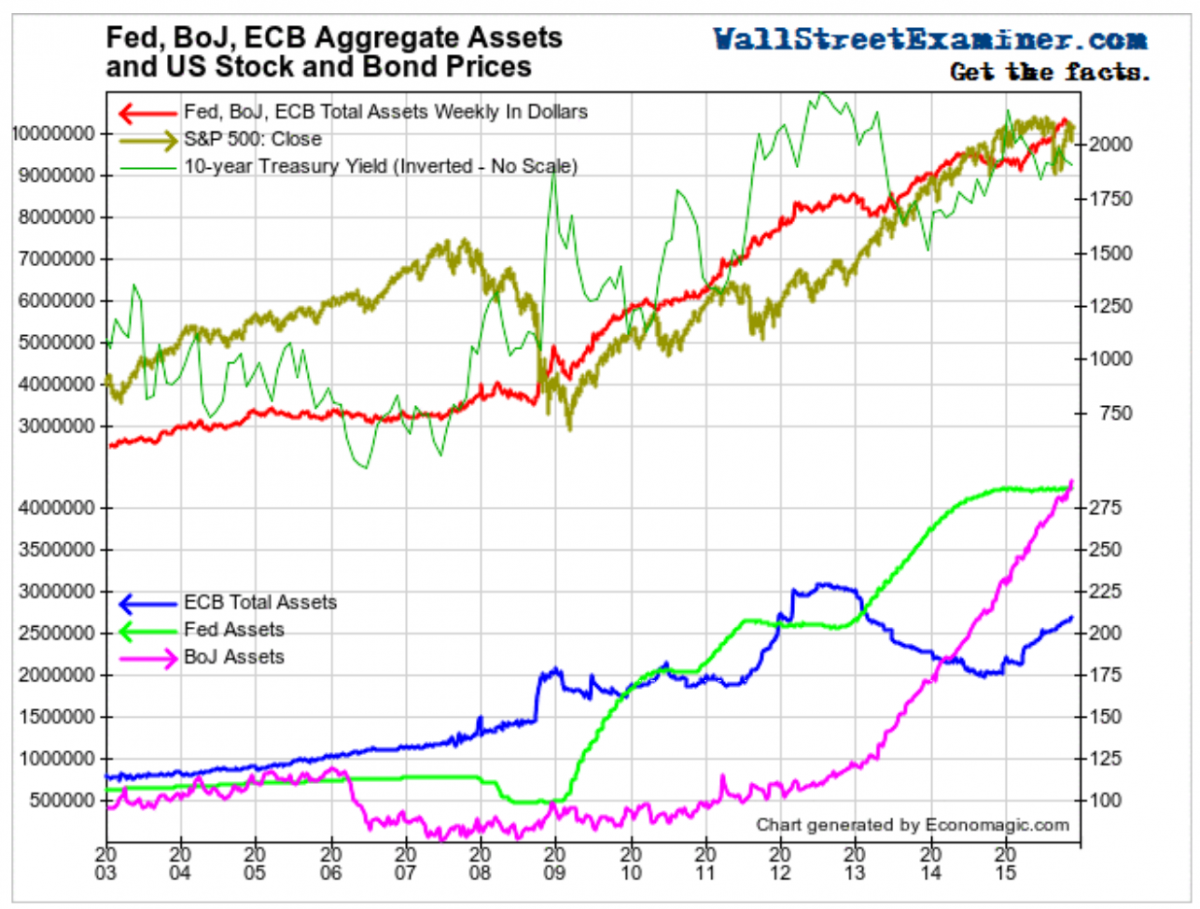
I was expecting a Wile E. Coyote moment if the market did not buckle in the wake of the $100 billion in Treasury supply settling on November 27 and 30. It hasn’t happened yet. Instead the market rallied on December 1. It forces us to consider the idea that the money printing by the ECB and BoJ is sufficient to keep the pot boiling in the US. The same worldwide dealers and institutions are drinking from the worldwide trough of central bank swill.
For most of this year [Central Bank action] has not been enough to keep prices trending upward, but it has been sufficient to keep prices from falling off the cliff when they threatened to. As a result, the players have once again been emboldened, and the central bank Draghi-Kuroda wizard tandem are pulling off amazing feats of market levitation.
Lee speculates that stocks are holding on to their gains because the ECB and BoJ are "pulling off amazing feats of market levitation." Of course that doesn't tell us when liquidity will decline and when the current rally will stop. But it does tell us that for now, the rally is still on.
Take a look at the following chart showing the Fed, ECB and BoJ assets and the S&P. While the Fed's assets haven't been growing lately, the ECB's and BoJ's have.

[For more, subscribe to Lee Adler's Liquidity Reports as part of the Macroliquidity Pro Trader Weekly or Macroliquidity Investor Monthly.]


