Courtesy of Dana Lyons
The beleaguered Dow Jones Transportation Average has dropped to a key support level.
One of the hardest hit sectors in the correction over the last 12 months has been the transportation sector. I say 12 months because the transports actually topped in December 2014, as measured by the Dow Jones Transportation Average (DJT). Since then, it has been rough traveling for these planes, trains and automobiles. It is especially concerning given the fact that fuel-related input costs have crashed over the same period. But that is a topic for another day.
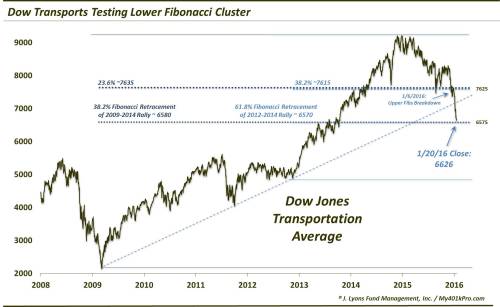
Simply off of the charts, we can see the damage that has been inflicted on the DJT and the significance of nearby levels. The struggles became apparent early last year as the DJT was unable to record higher highs along with most of the rest of the market. That said, a key level around 7625, characterized by the following significant Fibonacci Retracement levels, did manage to prevent a collapse in prices. This level supported the DJT in October 2014 as well as August and September 2015.
- The 23.6% Fibonacci Retracement of 2009-2014 Rally ~7635
- The 38.2% Fibonacci Retracement of 2012-2014 Rally ~7615
Additionally, the post-2009 Up trendline remained intact. This past December, these levels were again tested. As we have said often, the more times and the greater frequency with which a level gets tested, the more likely it is to break. And on January 6, the DJT broke these key levels, as did many other important indices as outlined in our post that day. The loss of the 7625 level opened up further downside to around the 6575 level, or about another 14% drop. That level marked the next sequential key Fibonacci cluster, as signified by:
- The 38.2% Fibonacci Retracement of 2009-2014 Rally ~6580
- The 61.8% Fibonacci Retracement of 2012-2014 Rally ~6570
The relentless selling pressure over the past 2 weeks has brought the DJT down to that level already. The DJT actually hit an intraday low of 6403 yesterday before closing at 6626.

If you are a transportation bull, you are going to want this level to hold. And in normal times, we would expect that it would, at least temporarily. Whether these are normal times or not is unknown. But for now, this is the key spot for the DJT to hold. Any break below there must, in our view, be recovered quickly lest an outright collapse unfold. For the next level of support in the Fibonacci sequence occurs at the 2012 low/61.8% Fibonacci Retracement of the 2009-2014 rally around 4880. That’s another 25% lower from current levels.
Given the way the events have unfolded in the sector over the past 12 months, along with our longer-term outlook for the stock market, it would not be surprising to eventually see the DJT at those lower levels. Bulls would just prefer that the transports take the scenic route to get there as opposed to the express train.
* * *
More from Dana Lyons, JLFMI and My401kPro.


