Courtesy of Dana Lyons
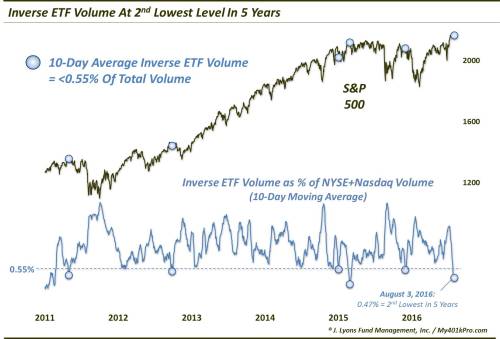
Volume in inverse ETF’s has dropped to its 2nd lowest level in more than 5 years; have traders become too complacent?
We have mentioned often that skeptical sentiment has greatly contributed to the magnitude and duration of the stock market rally since February. Traders were relatively slow to embrace the rally, which served to insure a steady influx of new capital as the advance progressed. That said, as we suggested it would, sentiment began to improve markedly following the July breakouts in the major averages and various sectors. On Monday, we looked at the NAAIM survey of active manager equity exposure which showed an average of over 100% exposure among its respondents for one of the few times in its history. Today, we look at another area of the market that is suggesting sentiment has finally begun to swing more aggressively to the bullish side: inverse equity ETF trading.
If you are not familiar with “inverse ETF’s”, they are designed to move counter to a specific index. For example, an inverse S&P 500 ETF (e.g., SH or SDS) is designed to move up when the S&P 500 moves down and vice versa. So these funds are very popular among traders wanting to “short” the stock market, or at least hedge their portfolio, in the event of a market decline. Monitoring the trading activity in these instruments can also provide a useful gauge of investor sentiment.
We first picked up this concept from Jason Goepfert’s awesome research site, Sentimentrader.com. Specifically, we track the trading volume in a group of popular inverse equity ETF’s and measure that versus the overall volume in the market. Historically (i.e., back about 6-8 years when inverse ETF’s became mainstream enough to track), relative inverse ETF volume picks up significantly during market declines and tapers off significantly during rallies.
Thus, very high levels of inverse ETF volume are indicative of elevated fear and have been pretty good markers of market bottoms, e.g., August 24, 2015. On the other end of the spectrum, very low levels of inverse ETF volume can be a sign of complacency, indicative of market tops of varying degrees (though, like most metrics, the “top” signals are less reliable than the bottom signals). A low level of inverse ETF volume may indicate that investors have very little in the way of “hedges” and, therefore, may be especially vulnerable in a decline.
This notion is relevant presently as, on a 10-day basis, relative inverse equity ETF volume has dropped to its 2nd lowest level in more than 5 years.

As the chart indicates, there have been 5 previous instances over the past 5 years in which relative inverse ETF volume dropped down close to these levels:
4/29/2011
9/27/2012
1/5/2015
2/23/2015
12/2/2015
And whether it was just a few days or weeks, or a full-fledged intermediate-term correction, each of these instances preceded selloffs of varying degrees. Here is the aggregate performance of the S&P 500 following these 5 prior events.

As the table indicates, the sweet spot for weakness occurs in the range between short and intermediate-term, specifically 2 weeks to 3 months. By 1 month, 4 of the 5 events had experienced a drawdown of at least -3% (January 2015 was the exception). By 2 months, the median drawdown was -6.5%. So while this occurrence may turn out differently, the track record certainly is not pretty.
Now, this study comes with plenty of caveats and asterisks, etc. First off, why do we start the study in 2011? Simply because the inverse ETF market was still maturing up until that point (even in early 2011, the chart shows volume well below even the recent low extremes). Therefore, data points prior to 2011 may not be relevant, or at least as reliable, as comparable signals.
Additionally, 5 precedents is obviously a very small sample size. Therefore, it may be somewhat dubious to draw definitive conclusions from this study. However, the fact that volume is so low now, despite the maturity and widespread adoption of inverse ETF’s, is undoubtedly a more reliable sign of investor complacency than it was 6 years ago.
And that is the main point. While skeptical sentiment allowed the post-February equity rally to climb higher and last longer than many would have expected, it is difficult to argue the existence of such a condition right now. Indeed, since the large-cap breakout to new highs, evidence of arguably extreme bullishness has begun to pop up. That includes this relatively depressed level of inverse ETF volume, a condition that suggests investors are quite comfortable – or complacent – regarding the stock market currently. Such complacency also means investors are less hedged and, thus, more susceptible to a market decline.
If recent history is any indication, such a decline (of some magnitude and duration) is likely not too far off.
* * *
More from Dana Lyons, JLFMI and My401kPro.


