Courtesy of Chris Kimble.
If one has been long bonds since July of 2015, its been a long and hard 6-months, as bond prices have fallen hard/yields shot up. Could rates be peaking and bond prices at lows? For sure the short-term trend in bonds is down and yields up. Is the longer-term trend about to change???
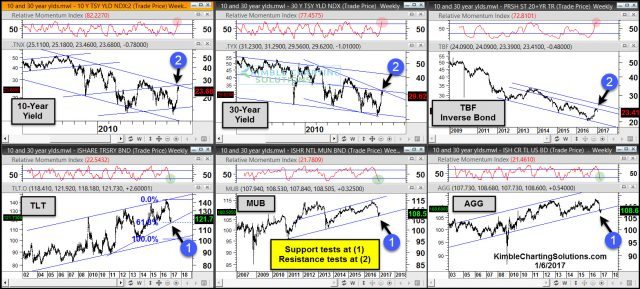
Below looks at our rate 6-pack, which looks at price and yields.
CLICK ON CHART TO ENLARGE
The top row reflects that yields and inverse bond ETF TBF, are all testing falling resistance in a downtrend, with momentum lofty. The bottom row reflects that bond prices are testing support of rising channels, with momentum deeply oversold.
Sentimentrader.com reports that bond bulls on the 10-year yield are hard to find, as the bullish percentage now stands at 0%!
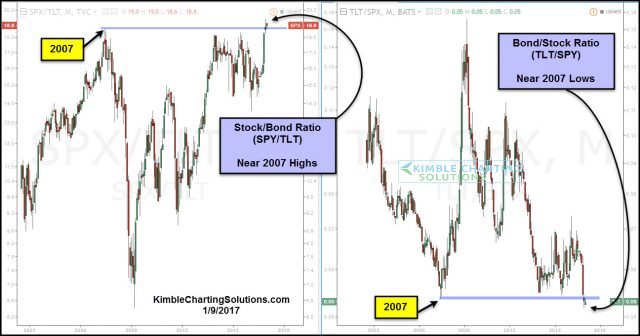
Below looks at the Stock/Bond and Bond/Stock ratios, which compares the S&P to TLT, since TLT’s inception.
CLICK ON CHART TO ENLARGE
With yields testing falling resistance and bond prices testing rising support, the above ratio could become important when it comes to portfolio construction!
Full Disclosure; Premium Members shorted bonds at the highs in July and have recently purchased a long bond ETF
To become a member of Kimble Charting Solutions, click here.


