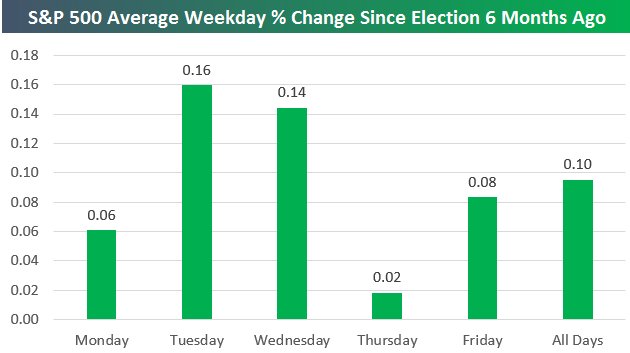
 If it's Tuesday we must be testing new highs.
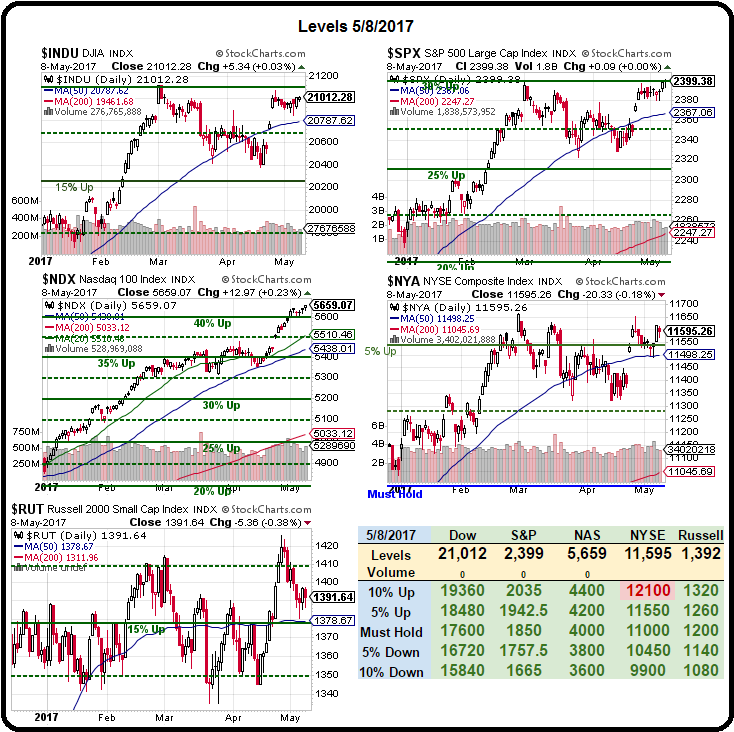
The S&P 500 finished the day at 2,399.38 to start the week and yes, we're still shorting below the 2,400 line on the /ES Futures (with tight stops above) because it's very rewarding if we get a pullback. 2,400 is a tough line to cross – it's up 200% from where we bottomed in 2009 and up 50% from the highs we made before the crash (1,600). With almost all of the S&P 500 companies reporting, earnings are indeed up 13% over last year (weak comps, we crashed last year) but are they up 50% from 2006?
Generally, the answer is no. In 2006, the S&P 500 companies earned $98.47 per index share and the S&P topped out at 1,600 which was a p/e of 16.24. Last year, the S&P 500 companies earned $95.48 and, even if we extrapolate a 13% bump to go through the entire year, that's just $107.89 and, at 2,400 – it comes out to a p/e of 22.24 so the market may be up 50%, but we're just paying 37% more for each Dollar of earnings. I'm not sure that's really progress.
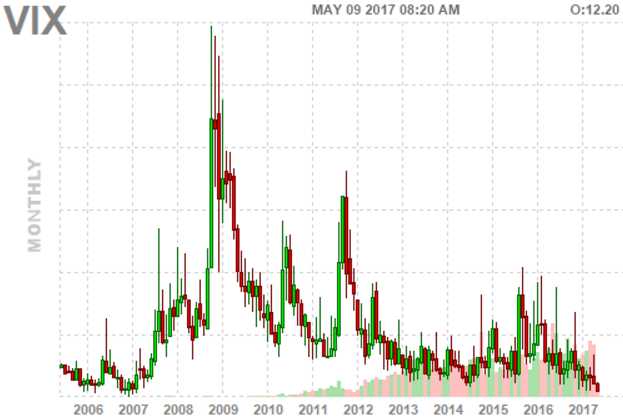
 Still, investor complacency has never been higher, as evidenced by the Volatility Index (VIX), which is back to it's pre-crash lows. That makes long VIX an interesting hedge at this point and yes, that's been a terrible bet in general but that's what hedges are in a bull market and it's kind of hard to imagine how investors can be any more complacent (VIX is 9.59 this morning) while there's plenty of evidence of it spiking over 20 – even in this downturn and we were in the 60s during the crash.
The VIX has a short ETF (SVXY) that makes for a fun short if we assume the VIX goes higher. As the SVXY is at $155 this morning, I like the idea of buying the September $145 puts for $16 and selling the Sept $105 puts for $4.50 and that would be net $11.50 on the $40 spread with a potential for $28.50 (247%) of upside potential if volatility spikes and sends SVXY lower. We can also sell some June $120 puts for $2.25 while we wait to further lower our cost. The June $120 puts have a Delta of 0.11 so it would take a 10-point drop in SVXY for us to lose $1.10 so we can put a stop at $3.50 on the June puts and that would only trigger if our long spread goes in the money.
Since our Options Opportunity Portfolio should make about $7,500 a month in a bullish market, we can take 1/3 of our anticipated gains between now and Sept and use them to hedge the possibility that the market drops on us. In that case, the trade setup would be:
- Buy 10 SVXY Sept $145 puts for $16 ($16,000)
- Sell 10 SVXY Sept $105 puts for $4.50 ($4,500)
- Sell 10 SVXY June $120 puts for $2.25 ($2,500)
Now we've dropped the net cash outlay to $9,000 (and we'll sell July and Aug puts too, once the Junes expire) and, if we have to buy back the $120 puts for $3.50, that's another $3,500 so $12,500 is our maximum outlay on a potential $40,000 spread but keep in mind this is INSURANCE, not a bet. We have LOTS of bullish positions we are protecting that will make 3-4 times what we are spending on the insurance if the market stays positive (and how do we know this – because we are Being the House – NOT the Gambler!).
Once we lay down some more hedges, we'll be looking over our Watch List to see about adding some more longs because, so far, there's no stopping this market and, while the action is very much like 1999 – the market doubled in 1999 and didn't crash until 2000 – no sense missing all that rally if it's going to keep going but, for now, we love those /ES shorts!


