Here we go again.
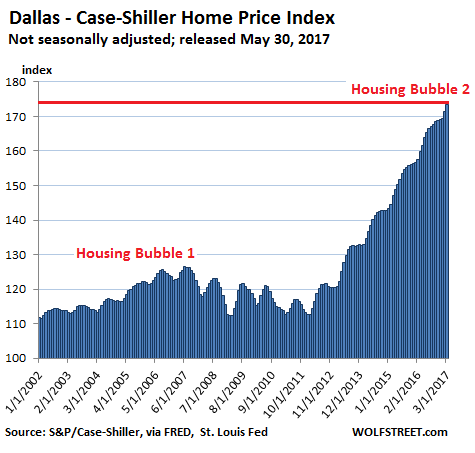
As you can see from Naked Capitalism's Case-Shiller Chart, those who forget the mistakes of the past are doomed to repeat them and we just passed the last "out of control" housing peak. As the Fed's Neel Kashkari said about housing prices:
“It is really hard to spot bubbles with any confidence before they burst. Everyone can recognize a bubble after it bursts, and then many people convince themselves that they saw it on the way up.”
As noted by Scofield, it's really not hard at all to see when you are in a bubble, the hard part is predicting when they will finally burst. Housing prices jumped 7.7% from last year, far outpacing the growth in household incomes, thus making homes more and more unaffordable for the average buyer. However, the people buying homes are above average – generally in the Top 10% of Income Earnings which, in Donald Trump's America, makes them better people than the other 90% of you and more deserving of a good home.
After all, what else matters in life but how much money you make, right? Of course right – you voted for it!
 Some regions are more bubbly than others, mostly in Texas and out west (Seattle, Denver, San Francisco) with massive gains since the last bubble burst. Yesterday's read on the Beige Book shows an economy that does not support this kind of housing recovery and just last night, San Francisco Fed President John Williams said the Fed is still on path for 2 more hikes in 2017 with a goal of 3% by 2019.
That's up 2.5% from where we are now and do you know what happens to mortgage payments when they go from the current 3.5% average to 6%? Again, we only have to remember what happened in 2007/8 but, for example, a person buying a $250,000 house with a $200,000 mortgage pays $898/month at 3.5% but will pay $1,199/month at 6%. That's $300/month more, which is 33% and people don't buy houses, they buy mortgages so it's going to be up to the homeowners to bring the price of the home down low enough for people to be able to afford the mortgage.
 Also not included in Case-Shiller data is the insane increase in property taxes over the past decade with US states averaging 25% increases since 2009 adding an even larger burden to homebuyers. Since property taxes are generally determined against the property values, the rising prices of homes are a double hit on the homeowners – pair that with rising rates and that's exactly how you burst a bubble.
Yet the markets seem oblivious to the flashing DANGER sign dead ahead in the road – just as investors are oblivious to the very obviously overbought conditions of the markets in general – just as we were generally oblivious in 2007.
One of the big warning signs we got in 2007 was a slowdown in China and, this morning, China's PMI fell to 49.6 (contracting) from 50.3 last month. That's the lowest reading since June of 2016 and Output fell to 50.2 from 51 – indicating orders are slowing down along with manufacturing. Of course, in June 2016, China was on the way up from the downturn of 2015, which led to the crash of the Chinese market from 28,600 on the Hang Seng in May (what a coincidence!) of 2015 to 18,200 in Feb of 2016 (down 36%) while the Shanghai fell from 716 to 355 (down 50%) and, even now, it's only at 420 – never regaining it's old glory.

But the Hang Seng (Hong Kong Big Caps) has mainly recovered and is back to 25,666 and if that's not a sign to get out – I don't know what is! We've been shorting China's ETF (FXP) in our Options Opportunity Portfolio since April 3rd and our initial play was:
- Buy 10 FXP May $25 calls for $2.50 ($2,500)
- Sell 10 FXP May $28 calls for $1 ($1,000)
- Sell 3 CHL Sept $55 puts for $3 ($900)
That's net $600 on the $3,000 spread that's $2,000 in the money to start so not a tough bar set to make up to $2,400 (400%) in short order. China Mobile (NYSE:CHL) is my favorite Chinese stock and I would love to initiate a position on them so it's good cover in case Chinese stocks go higher and, if they don't, we can begin working on a position from there.
We made $1,000 on the short calls and CHL is up $270 but we lost $1,650 on the May call before we rolled it to the June $24 calls and, so far, they are down $970 so we're down net $1,350 down so far on 10. With FXP at $24.89 we can roll our 10 long June $24 calls ($1.15 = $1,150) to 20 Sept $22 ($3.40)/$26 ($1.40) bull call spreads at $2 ($4,000) so we'll spend net $2,850 which, with our $1,350 loss, puts us in the $8,000 spread for net $4,200 so we still have $3,800 upside potential if FXP gets back to $26 by Sept as well as the remaining $630 to be gained on the CHL position.
Again, we don't know WHEN the bubble will burst – we just want to be there when it does. I'll also be putting out an FXP long for our TradeExchange followers (just the straight ETF there) – as it's a nice hedge to the long positions we've taken.
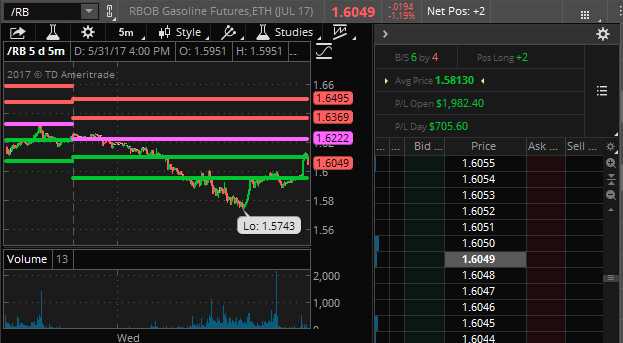
 Speaking of long positions, congratulations to those of you who went with our Live Trading Webinar plays yesterday to go long on Oil (/CL), Gasoline (/RB) and Natural Gas (/NGV7) Futures – all of which got a great pop off last night's API data. As you can see, we made a quick $1,000 per contract on the move in /RB and $750 per contract on /CL and /NG popped a nickel for $500 per contract there so a quick $2,250 gained from our Webinar trade ideas and we haven't even gotten a move in Coffee (/KC) yet!
That's what we do with our sideline cash. A futures contract uses about $4,000 in margin but generally we only hold them open for a few hours or a couple of days and our Options Opportunity Portfolio began on 8/8/15 with a virtual $100,000 and that portfolio is already just under $300,000 with 2 months to go until our 2nd anniversary yet we have $194,455 in CASH!!! (have I mentioned how much I like CASH!!! lately?), so we have tons of spare margin to make quick in and out trades like these.
You can follow our Options Opportunity Portfolio (OOP) as well as all of our other Member Portfolios over at Phil's Stock World, where it was originally called the 5% Portfolio, as our goal is to make 5% ($5,000) per month from our original $100,000 (and that's still how we play it) or you can just follow the OOP in the Seeking Alpha Marketplace though you already know how today's FXP trade idea looks (see above).
Be careful out there!


