Courtesy of Chris Kimble.
CLICK ON CHART TO ENLARGE
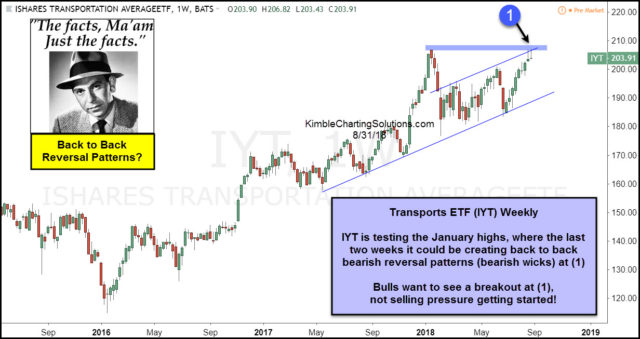
The chart looks at Transportation ETF (IYT) on a weekly basis. Its long-term trend remains up and nothing that has changed the trend.
IYT peaked in January along with the broad markets and then fell where it tested short-term rising channel support, which held.
Joe Friday Just The Facts Ma’am– IYT is testing its January highs, where it could be creating back to back bearish reversal pattern (bearish wicks) at (1).
Stock bulls want to see IYT breaking above January highs, not sellers coming forward and taking it lower!
–
To become a member of Kimble Charting Solutions, click here.


