 Will the 2nd time be a charm?
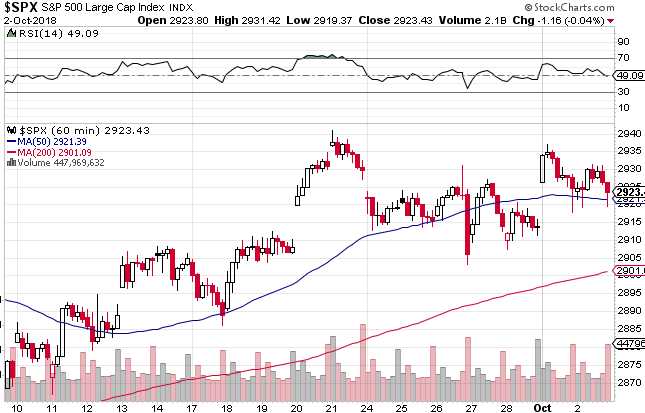
The S&P 500 will make another attempt at getting over the 2,940 line, which is 33.6% higher than our old "Must Hold" line at 2,200. 33.6% is not particularly significant, the real significant line is the 20% line at 2,640 and we haven't seen that since April and now we're over the 30% line (2,860) and it's probably time to move the goal posts as those lines were for the end of 2017 and the tax cuts have been a game-changer for the S&P 500 and anyone else who measures their earnings in Billions.
Companies aren't making more money – they are just paying less taxes but same difference to investors – as long as more goes to the bottom line. I'm not saying that 2,860 is likely to hold in the long run but, taking into account buybacks and repatriation of capital (ie tax avoidance) and lower tax rates – 2,640 is a reasonably good "Must Hold" level for the S&P going forward as the Must Hold Line represents a bearish break if it fails and 20% above (3,168) and 20% below (2,112) is the expected range the market should stay in.
Getting close to 3,000, it's hard to imagine 2,112 ever happening but I suppose we said that in 2000 and again in 2007, when the S&P was up at 1,550 and both times it fell 50% within the next two years. This time is different though – we're 50% higher now so, even if we fall 50%, we still end up back at the previous highs – that's progress!

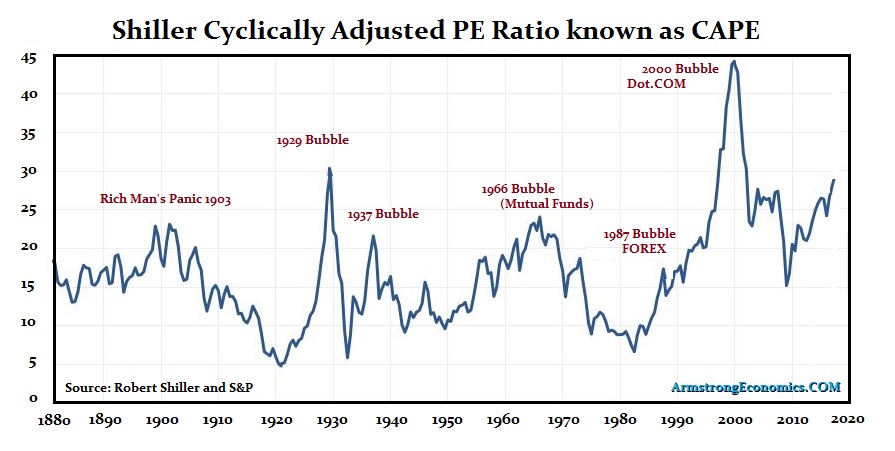
That's right, we're getting very close to that magical 3,000 level which, appropriately, would price the S&P 500 at 30 times it's trailing earnings but, if we assume forward earnings will go up and up forever and nothing will ever, ever, ever go wrong – then it's only 27 times earnings and that seems like a bargain these days, right?
 As you can see from the chart above, 30 on the CAPE index has popped every bubble since 1903 except the Dot.com bubble, which blasted the index all the way to 45 times earnings before collapsing so never underestimate the stupidity of your fellow traders – you really can fool some of the people all of the time and all of the people some of the time and that's a hell of a lot of suckers to hold the bags on the way up.
The chart on the left, however, indicates the price we are now paying for $1 of sales and THAT has never been higher than it is now. As I mentioned above, the low tax rates have impacted the bottom line earnings and mergers and buybacks have decreased the share counts by which those earnings are divided but that doesn't create actual sales – those have been lagging while the market has skyrocketed – so let's hope nothing happens to disrupt either the sales or the profits or this house of cards could collapse REALLY fast!
Meanwhile, we just lie back and enjoy the ride. Last Wednesday, in our Live Trading Webinar (and there's another one today at 1pm, EST), we went over 10 trade ideas (summarized in our Top Trade Idea of that day) that could make up to $100,000 by Christmas in anticipation of a flattening market. Granted it was only a week but let's see how they are working out:
1) Sell 20 BBBY Jan $20 calls for $1.50 ($3,000)
- Those are now 0.18 ($360) so up $2,640
2) Sell 10 CAKE 2021 $45 puts for $5.30 ($5,300)
Buy 25 CAKE 2021 $45 ($13.80)/$60 ($7) bull call spreads for $6.80 ($17,000)
Sell 15 CAKE Jan $55 calls for $2.85 ($4,275)
- Was net $7,425, now net $7,550 (up $125) so still good for a new trade on the $37,500 spread.
3) Sell 20 CMG Jan $460 calls for $37.30 ($74,600) and buy 20 CMG 2020 $460/580 bull call spreads for $44.75 ($89,500) for net $14,900
- That spread is now net $26,000 so up $11,100
4) Sell 30 GCI April $10 puts for $1 ($3,000)
Buy 50 GCI April $10 (0.95)/12.50 (0.20) bull call spreads for 0.75 ($3,750)
Sell 30 GCI Jan $10 calls for 0.75 ($2,250)
- Was net a net $1,500 credit, now net $1,450 credit so up $50 and still good for a new trade on the $12,500 spread.
5) Sell 15 of the GILD 2021 $67.50 puts for $8 ($12,000).
Buy 25 2021 $65 ($18.50)/80 ($11.50) bull call spreads for $7 ($17,500)
Sell 15 Jan $77.50 calls for $3.30 ($4,950)
- Was net $550 and now $1,450 so up $900 but still good for a new trade as it's a $37,500 spread so $36,600 upside potential remains!
6) Sell 20 GPRO 2020 $8 puts for $2 ($4,000)
Buy 40 of the 2021 $5 ($3)/10 ($1.10) bull call spreads at $1.90 ($7,600)
Sell 20 Jan $8 calls for 0.45 ($900)
- Was net $2,700 now $1,800 so down $900 and great for a new trade as it's a $20,000 spread.
7) Sell 10 M 2021 $30 puts for $5.25 ($5,250)
Buy 15 M 2021 $30 ($9)/$40 ($5) bull call spreads for net $4 ($6,000)
Sell 10 M Jan $35 calls for $2.70 ($2,700)
- Was a net $1,950 credit, now a net $1,715 credit is up $235 and still good for a new trade on the $15,000 spread.
8) Sell 5 PSA 2021 $200 puts for $24
- Still $24 and good for a new trade
9) Sell 10 TGT Jan $85 calls for $6.20 ($6,200)
Buy 10 TGT 2021 $80 ($17)/95 ($10) bull call spreads for $7 ($7,000)
- Was net $800, now net $1,750 so up $950
10) Sell 10 THC Jan $28 calls for $3 ($3,000)
Sell THC 10 2021 $23 puts for $5.50 ($5,500)
Buy THC 15 2021 $27 ($10.50)/37 ($6.50) bull call spreads for $4 ($6,000)
- Was a net $3,500 credit and now a net $1,350 credit so up $2,150
 So, in one week, our 10 trade ideas are up $17,250 already ($84,625 more is expected by Jan expirations) and all we are doing is applying our basic "Be the House – NOT the Gambler" strategy by selling more premium than we're buying on stocks we believe will be flat to down from here into the new year.
Our long-term positions have lower net deltas, so they lose less money on the way down and they have lower thetas – so they lose less money over time. Our criteria for selecting these 10 was that they were internally volatile stocks (so they offered good front-month premiums) but they had a long-term overall value that would allow us to stick with and adjust a position – even if they fell more than we expected.
Just because we don't like or trust the market, doesn't mean we can't make money while we wait. These trade ideas utilized very little cash and tapped into our sideline margin to pay us significantly more money than we would have made if we just left our cash sitting around while we wait for the correction that never comes.
We're still shorting the S&P (/ES) at 2,940 with tight stops above the line and the Dow (/YM) at 26,900 – also with tight stops above and we're shorting Oil (/CL) Futures at $75.50 – but very dangerous into inventories at 10:30 and, other than that – it's another "watch and wait" sort of day while we wait to see if the S&P can break over 2,940 and make a serious run at 3,000 because – why not?


