Courtesy of Chris Kimble.
Is the Banking sector sending a message that weaker economic times are ahead for the U.S. economy? Possible!

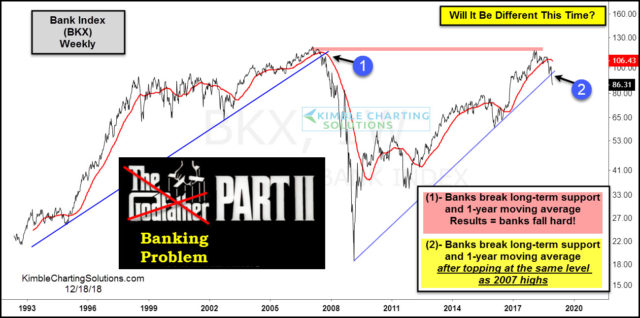
This chart looks at the Banking Index (BKX) over the past 25-years. It 2007 the index broke 11-year rising support and its 1-year moving average at (1). Once the index broke long-term support and the moving average, the banking crisis was underway, as the index declined over 80% in less than 2-years.
The index rally over the past few years, took it back to 2007 highs, where a double top looks to have formed earlier this year. The weakness of late has the index breaking 9-year rising support and its 1-year moving average at (2).
The ole saying “So Goes The Banks, So Goes The Broad Market” comes to mind when looking at this chart.
Keep a close eye on the banking index going forward friends! They have sent important messages to the broad markets in the past and odds are high they will do it again!
–
To become a member of Kimble Charting Solutions, click here.


