Courtesy of Chris Kimble.
Is one of the hottest stock indices in the world about to peak? Possible.
The S&P is off to a great start this year, up over 12%. Yet the Shanghai index is white hot, up around 22%, almost twice as much as the S&P 500!
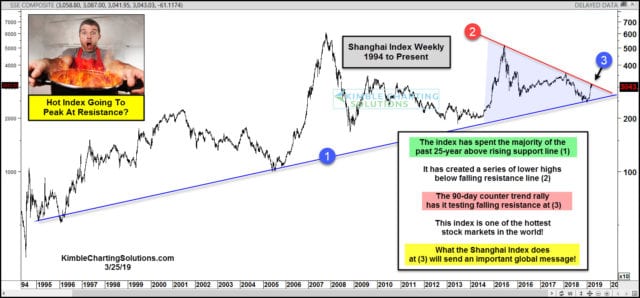
This chart looks at the Shanghai Index over the past 25-years on a weekly basis. It has spent the majority of the past 25-year above rising support line (1). It hit this rising support line in December, where a very strong counter-trend rally has taken place.
Over the past 4-years, the index has created a series of lower highs, which forms the line (2). The 90-day counter-trend rally now has the Shanghai index testing falling resistance at (3).
What this white-hot index does at (3), will send a very important message to stocks around the world. Keep a close eye on the Shanghai index going forward friends!!!
–
To become a member of Kimble Charting Solutions, click here.


