Courtesy of Chris Kimble
Gold/Metals bulls want to pay attention to how this indicator handles a current breakout test!
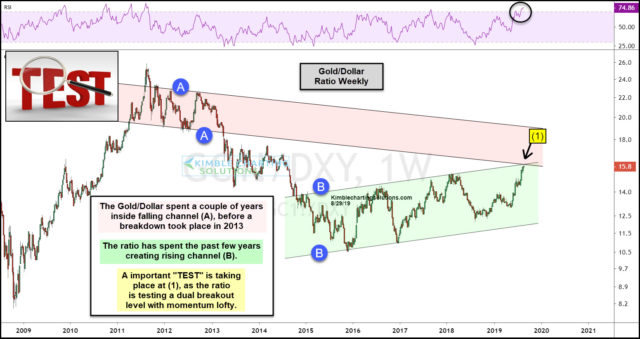
This chart looks at the Gold/Dollar ratio on a weekly basis over the past decade.
The ratio created a falling channel (A) from 2011 to 2013. Once support broke Gold continued to be much weaker than the US Dollar for a few years.
The ratio started creating a rising channel (B) in 2016/2017, as higher lows started forming. These higher lows reflected that Gold was outperforming the US Dollar.
The rally over the past couple of years has the ratio testing the top of rising channel (B) and the underside of falling channel (A) at (1).
It appears that a very important long-term breakout test is in play currently, with momentum at the highest level in 8-years.
How the ratio handles this breakout test will send Gold and Silver a very important long-term message.
To become a member of Kimble Charting Solutions, click here.


