 Curiouser and curiouser.
Now we're approaching 3,150 on the S&P 500 (/ES) and my prediction was 3,300 IF we got a trade deal (and then back below 3,000) but, if we're getting this simply on rumors of a partial trade deal maybe happening sometime – who knows what madness lies ahead?
"One pill makes you larger, and one pill makes you small
And the ones that mother gives you, don't do anything at allGo ask Alice, when she's ten feet tallAnd if you go chasing rabbits, and you know you're going to fall" – Jefferson Airplane
 Uh oh! The last time I started making Alice in Wonderland references about the stock market being ridiculous was back in the Summer of 2008 when, as it turned out – it was ridiculous and we crashed horribly soon after. Today we are celebrating that crash's UnBirthday though the situation is a bit different this time and apparently traders have gotten older – simply not wiser…
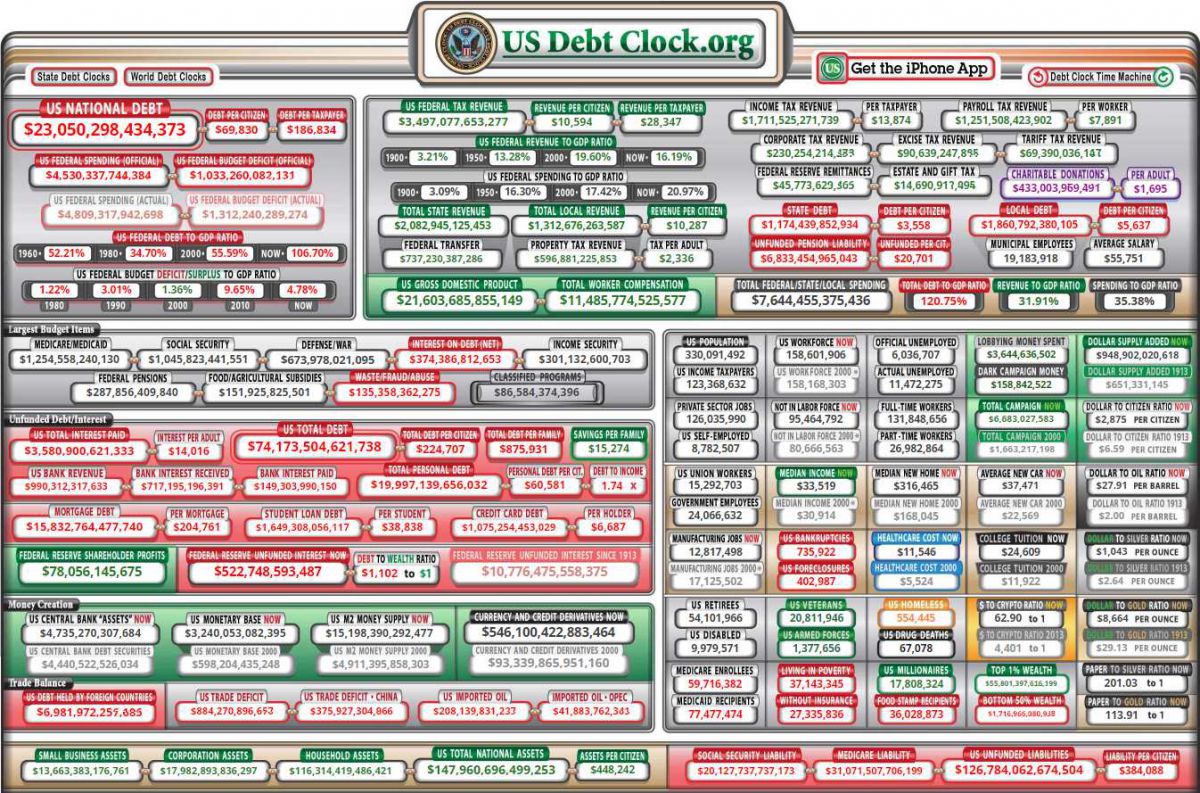
Back in 2008 oil was over $100 per barrel and most people thought it was a sign of a strong economy but I said "How can the Consumers afford to keep paying this?" and, lo and behold – they could not. Now we have a rally that is fueled not by oil money but FREE MONEY and, while Consumers are spending at record levels – their debts are piling up at record levels as well. How can the Consumers and the Government afford to keep paying this?
That, my friends, is a HELL of a thing to ignore – isn't it? The National Debt was, in fact $11.5Tn at the start of 2009 so we're up almost exactly 100% since then but the statistic we should keep in mind was that our GDP (real), at the time, was $15.6Tn and now it's $18.6Tn – up just $3Tn after spending $11.5Tn to boost it – hardly an efficient use of the money, is it? Also, the $1.15Tn/year we've spent in debt over 10 years has been 6.7% of our average $17Tn GDP but growth has NEVER been 6.7% (actually 2% avg growth) – what have we been buying then?
 The idea of debt spending is that we grow the economy sufficiently to make paying back the debt easier than it was when it began and then, the logic followed, that there would be no better way to grow the economy than by giving massive tax cuts to people who were already rich who would then, in turn, trickle down on the rest of us. Boy are we stupid or what?
Things should be "great again" by now as U.S. unemployment is as low as it’s been in nearly two decades (3.6% as of the last report) and the nation’s private-sector employers have been adding jobs for 104 straight months – 19.5 Million since the Great Recession-related cuts finally abated in early 2010, and 1.8M just since the beginning of the year.
However, according to Pew Research, despite the strong labor market, wage growth has lagged economists’ expectations. In fact, despite some ups and downs over the past several decades, today’s real average wage (that is, the wage after accounting for inflation) has about the same purchasing power it did 40 years ago. And what wage gains there have been have mostly flowed to the highest-paid tier of workers.
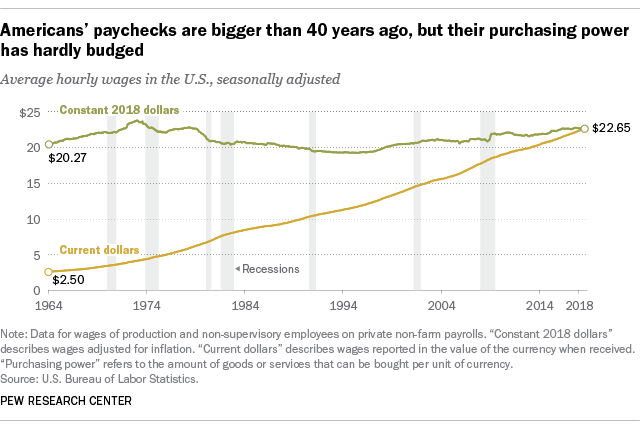
After adjusting for inflation, however, today’s average hourly wage has just about the same purchasing power it did in 1978, following a long slide in the 1980s and early 1990s and bumpy, inconsistent growth since then. In fact, in real terms average hourly earnings peaked more than 45 years ago: The $4.03-an-hour rate recorded in January 1973 had the same purchasing power that $23.68 would today. No wonder I felt so rich when I had my paper route – I was pulling down $25 a week!
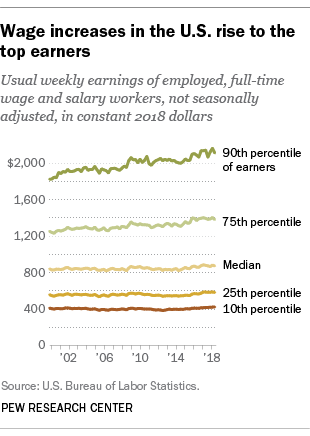 Meanwhile, Wage Gains have gone largely to the highest earners. Since 2000, usual weekly wages have risen 3% (in real terms) among workers in the lowest tenth of the earnings distribution and 4.3% among the lowest quarter. But among people in the top tenth of the distribution, Real Wages have risen a cumulative 15.7%, to $2,112 a week – nearly five times the usual weekly earnings of the bottom tenth ($426).
That's how we now have two very different Americas. If you are in the Top 10% and even the Top 25% – you feel like things have improved quite a bit since the recession but the bottom 75% – 250M of our fellow countrymen – have a far different perspective on things but, in reality, how often do you really talk to those people in your daily life?
That's how we live in our bubbles and when your maid tells you her sister is in the hospital and can't afford an operation so they had to cut off her leg rather than save it – it's very easy to go "oh well" and think it's an unfortunate event but that is NORMAL for 75% of the country. The guy washing your car doesn't get to add Disney Plus for his kids when it comes out – not without giving up some other monthly expense and the person bagging your groceries at the store has to pay the same $3 fee to use an ATM to withdraw $20 as you do to withdraw $200 – things are grossly unfair for the bottom 75% and they are getting less fair every day – where do you think our money is coming from?
 The Fed's latest figures on American household wealth paint a rosy picture (for now) — in the aggregate. US households now own a record-breaking $107T worth of assets! But drill into those figures and you'll notice that almost all of this new wealth has landed in the pockets of the top 1% of households. That's not unusual: America has been on a glide-path to oligarchy since the Reagan years. What's also not new is that the share of wealth owned by the bottom 50% of American households has continued to fall, while their debts have continued to rise: the bottom half own 6.1% of all US wealth, while they are burdened with 36% of America's debts. When you subtract debts from assets, the bottom half of US households account for only 1.9% of America's assets.
What that tells us is that the top 1%'s growth can no longer come from the bottom half, the people whose political woes and economic anxiety do not provoke regulators or lawmakers to actions. And indeed, when you look at the Fed's quarterly figures, you see that the biggest decline in household wealth is now coming from the upper middle class, the 50%-99% of households, who are, basically, the last people left in America with piggybanks for oligarchs to empty – exactly as I predicted this decade would end way back in my 2010 outlook.
There's lots of ways in which wealth-transfers from the upper-middles to the super-rich are effected: while upper-middles might own stocks, they don't get to buy into private equity funds or VC funds, where table-stakes are $5m. Meanwhile, the most common assets for the middles — CDs, savings accounts — have been stagnant for more than a decade, thanks to the Fed's low-interest policies.
Meanwhile, the things that define middle-class life — quality health care, post-secondary education, decent housing — have soared in costs, far, far ahead of the modest gains experienced by the 50-99%. Those increased costs are largely due to market-cornering and price-gouging by companies that have been bought up by the private equity sector whose beneficiaries are almost exclusively the super-rich.
- The top 1%’s share of household wealth over those ten years increased by 5 percentage points to 32%. The 1% now own nearly one-third of total household wealth,
- But over those 10 years, the share of household wealth owned by the next 9% fell by 3 percentage points to 37%.
- And the share of the 50% to 90%, the upper middle class, also fell by 3 percentage points to 29%.
- Today, the share of the 1% is nearly 4 percentage points higher than the share of the 50% to 90%.
- Back in 2002, it was reverse: The share of the 1% was about 10 percentage points lower than the share of the 50% to 90%.
- The first time that the 1% had a larger share of household wealth than the 50% to 90% was in 2013, and the gap has ballooned since.
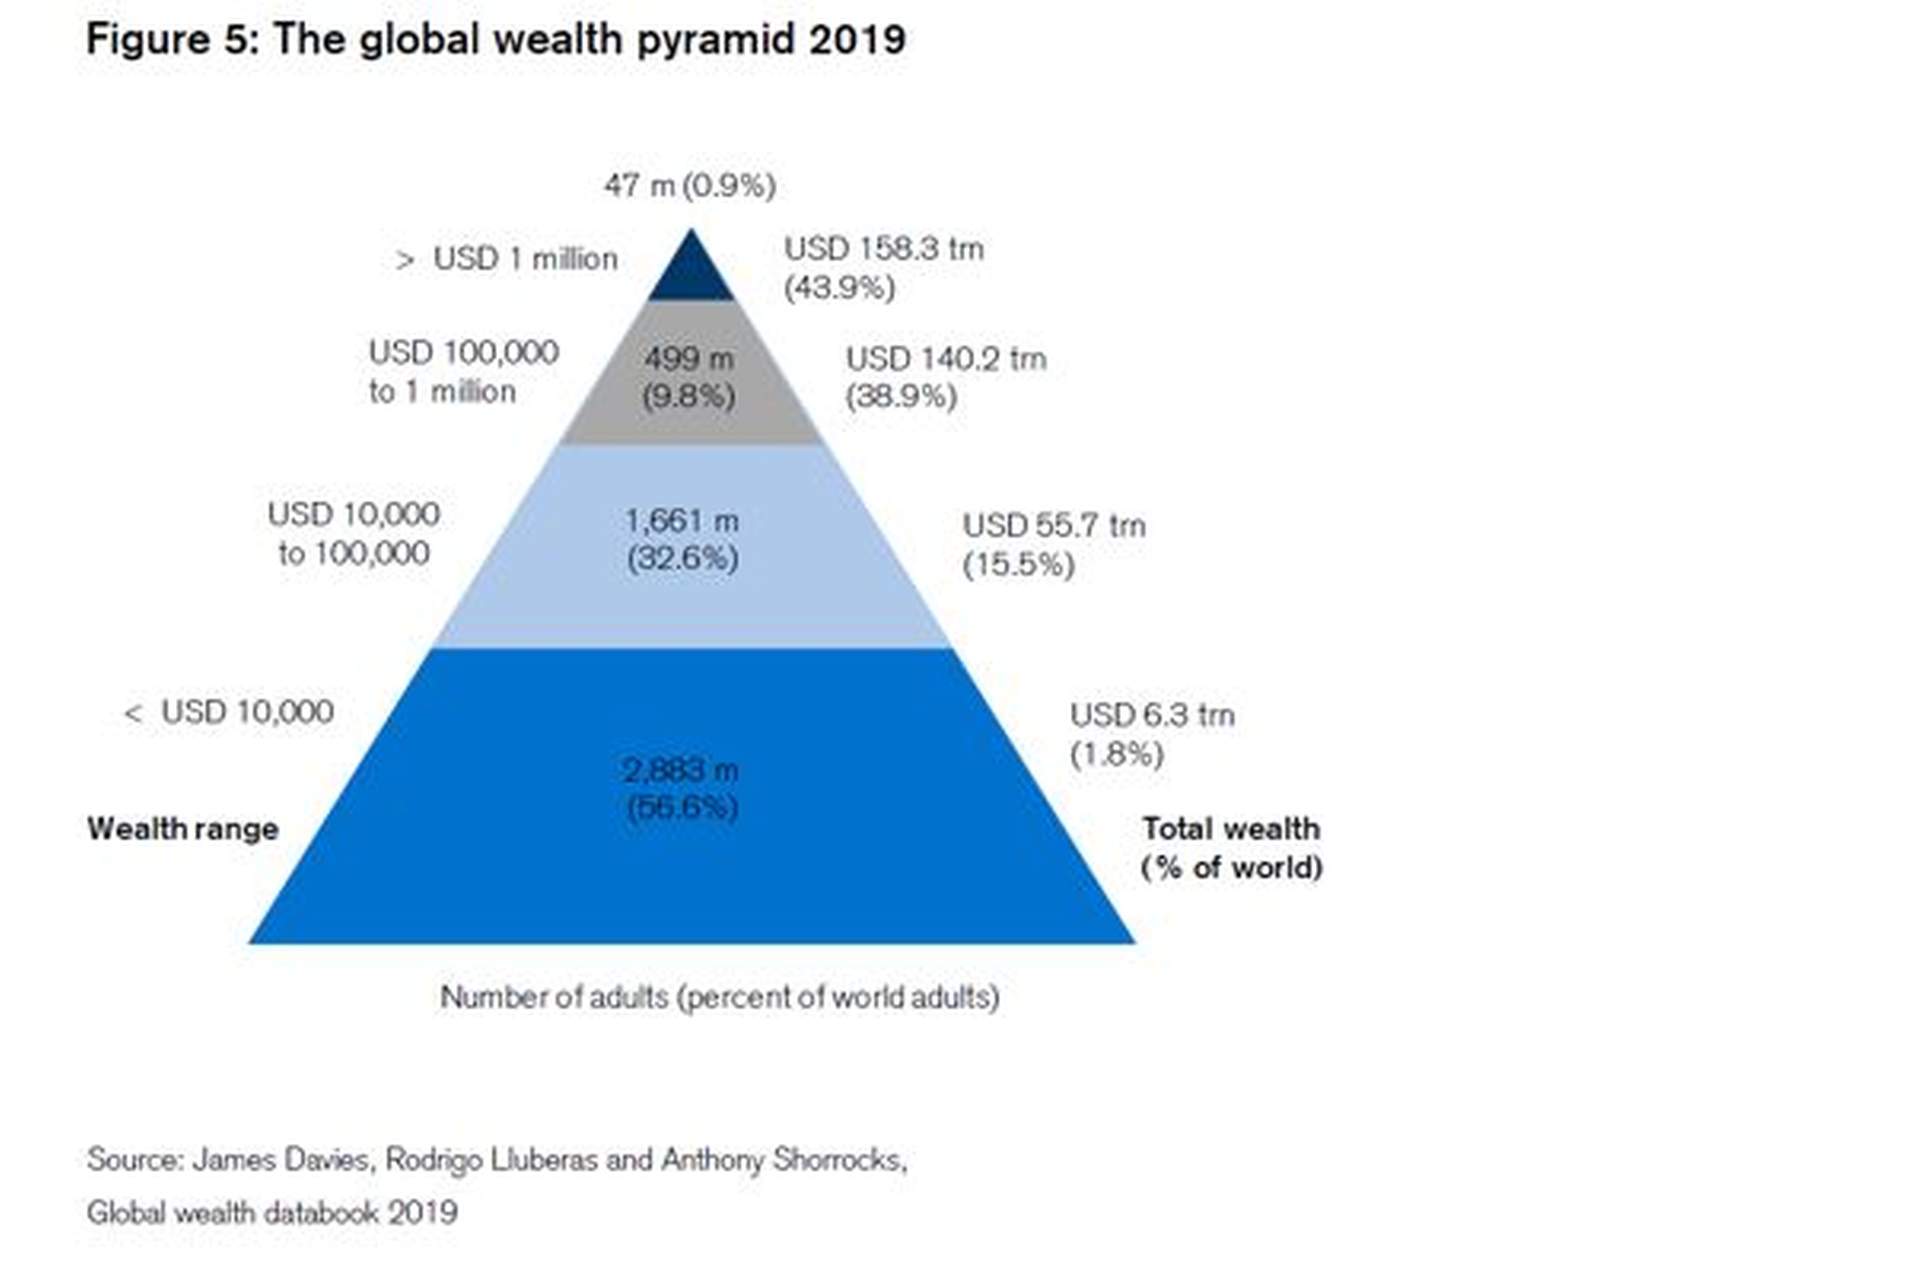
 As the wealth gap keeps expanding, either the Top 1% need to start giving back (as Sanders and Warren suggest) or they can keep taking from the Bottom 99% but, as you can see from the pyramid above, the bottom 50% (2.8Bn people with less than $10,000 in assets) literally have nothing left to give and neither does the rapidly shrinking middle class (1.6Bn people with $10,000-$100,000 in assets) and that leaves the 500M Global Citizens with $100,000 to $1M in assets who need to contribute to those 47M people who have $1M or more in order for the Top 1% to grow their wealth pile any further.
If the Top 1% gave up 4% of their wealth, they would double the wealth of the bottom 2.8Bn people. That's the simplicity of the Warren/Sanders Wealth Tax – take the money from 47M people who won't miss it and give it to the 3Bn people whose lives it would completely change. If only this were a Democracy and those 3Bn people could vote for it.…


