Courtesy of Chris Kimble
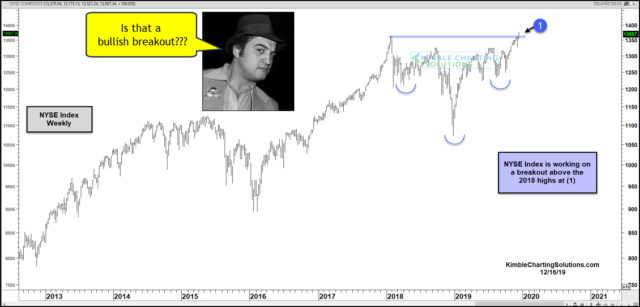
The New York Stock Exchange hasn’t had much to brag about for the past 2-years! Are things about to change for this broad-based index? What happens at (1), looks to be very important for this index and the S&P 500 as well.
This chart looks at the NYSE index over the past 6-years on a weekly basis. Over the past 2-years, could the index be forming a very bullish pattern? Possible!
The index this week is testing the 2018 highs as it could be experiencing a breakout above those highs. It remains possible that that index has created a nearly 2-year bullish pattern, with the neckline being the 2018 highs.
If this index succeeds in pushing a good deal higher above the 2018 highs at (1), it sends a broad-based bullish message to large and small-cap stocks!
To become a member of Kimble Charting Solutions, click here.


