Courtesy of Chris Kimble
Are we headed towards a Depression or is the worst already behind us? In today’s world, comparisons to the great depression are easy to find.
Are the Depression concerns well founded or are the declines of late already pricing in a bottom?
In my humble opinion, this chart and the upcoming price action of this index will go miles and miles towards telling us if we are headed towards very tough times or if the huge declines of late are actually in a bottoming process.
This chart looks at the Thomson Reuters Equal Weighted Commodity Index on a monthly basis over the past 54 years. The index has been heading south, reflecting weakness in demand for basic commodities over the past 9 years, despite easing of credit around the world by central banks.
The index tested 29-year support in 2009, which ended up holding, reflecting the worst of the financial crisis was priced into the market.
Now the decline over the past 9 years has the commodity index currently testing the 2009 lows. This support is support until broken!
Joe Friday Just The Facts Ma’am; If the index holds at 2009 support, it would suggest that lows are in play and the worst has already been priced into the markets. If the index breaks this 40-year support/resistance line, it would suggest that some really tough times are ahead! What this index does from here, friends will send all of us a very important message about the future of the macroeconomy.
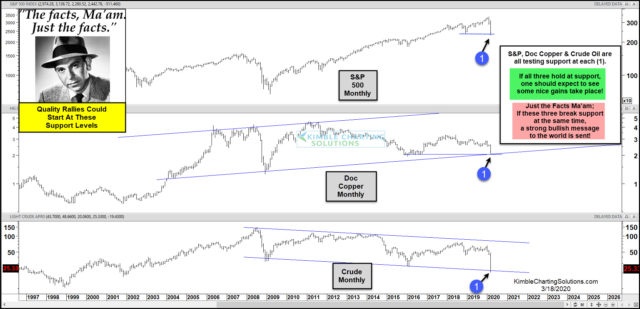
Two weeks ago today, Joe Friday reflected that “Three support levels” were in play, sending important messages to the markets. See Post Here
This 3-pack reflected that the S&P, Doc Copper and Crude Oil were ALL facing support tests at each (1). Remember, support is support until broken!
What has happened since Joe Friday shared that strong support levels were in play? The S&P has experienced the largest 3-day rally since the 1930’s and yesterday (4/2) Crude Oil experienced the largest single-day rally (Up +26%) in the past 40-years!
Just the Facts Ma’am; Crude Oil, Doc Copper, S&P 500 and the TR commodity index are ALL TESTING LONG-TERM SUPPORT LEVELS AT THE SAME TIME! What these four assets do at these support tests will go miles and miles towards answering if a Depression is coming or the worst is already priced into the markets!!!
If you would like to stay abreast of these support levels in all four markets, you can receive regular updates and actionable strategies by registering for our most popular research report, the Combo Package.
To become a member of Kimble Charting Solutions, click here.


