Courtesy of Chris Kimble
Does history repeat exactly? No. Sometimes it rhymes big-times!!!
This chart looks at the S&P 500 over the past 25-years on a weekly basis.
During the 50% bear markets of 2000-2003 and 2007-2009, the S&P started quality counter-trend rallies very near the first week of spring (3/21).
If the S&P 500 is going to repeat the large bear markets of the past, would it be important to be aware of where counter-trend rallies started and ended? Yes!
The strong rally over the past month started right on schedule, as the low took place on 3/20, similar to the rallies in 2001 and 2008!!!
The counter-trend rallies in the bear markets mentioned above, both peaked 8-weeks? The trillion-dollar question a month after the 3/20/20 low is; Will it be different this time.
Does the current S&P decline look “Eerily” like bear markets of the past?
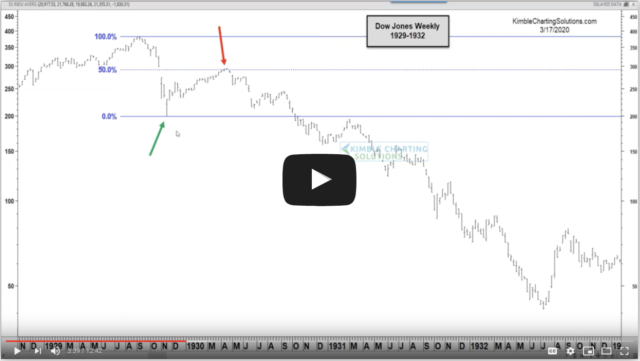
We put together this video details what the four largest bear markets of the past 100-years looked & acted like. CLICK HERE to watch this video.
In honor of my 40th anniversary in the business, check out how to receive 40% off our most popular research reports.
To become a member of Kimble Charting Solutions, click here.


