Courtesy of Chris Kimble
Economically sensitive stocks have frequently sent an important message to the S&P 500. Is it possible that the largest bearish reversal pattern in 20-years could be sending an important message?
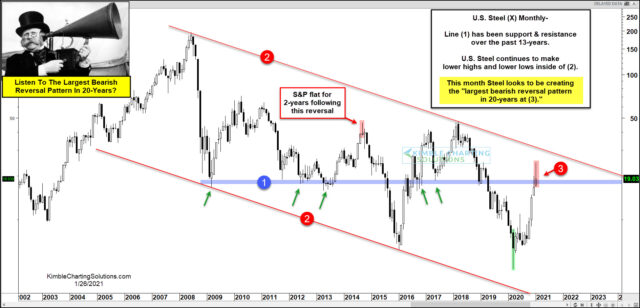
This chart looks at U.S. Steel (X) on a monthly basis over the past 20-years. Since the 2008 highs, “X” has created a series of lower highs and lower lows, creating a falling channel (2). Over the past 13-years, line (1) has come into play as support and resistance numerous times.
“X” created the largest bullish reversal pattern in 20-years in March of 2020. The rally following the bullish reversal pattern has “X” testing the underside of the line (1) at (3). As the month is nearing a close, “X” looks to be creating the largest reversal pattern in the past 20-years at (3).
The second-largest bearish reversal pattern in 20-years took place in 2014 and the S&P traded sideways for the next 24-months.
If U.S. Steel ends the month with a large bearish reversal pattern, odds increase it is suggesting that the counter-trend inflation rally is running out of steam.
To become a member of Kimble Charting Solutions, click here.


