 Jobs report today.
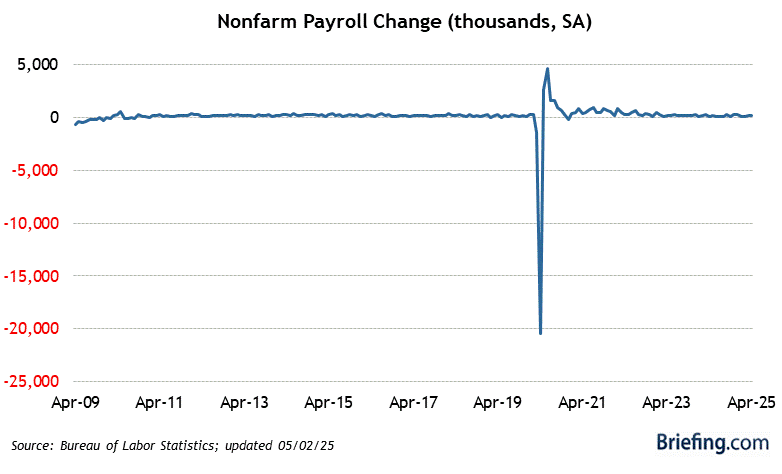
In September we added an anemic 194,000 jobs and October is projected to rebound to 450,000 but does it matter? The S&P 500 is up 100 points (2%) this week and up almost 10% since we got that crappy payroll report last month. The economic numbers haven't been good and earnings have not been great but, in 19 out of 23 market days since the last NFP Report, the market has gone up and up and up and up.
We're investors, we should be happy. Our Long-Term Portfolio, which we last reviewed on October 15th, is up $50,000 (10%) for the month – and we only made 3 changes in the last review. Just sit back and make money is what the market is teaching us but, do you know what that's called? Complacency! And complacency is a very dangerous disease for a trade to catch. The SPY ETF hasn't cracked 100M in volume since October 6th and it's been closer to 50M most days – 50M is the kind of volume we used to see on half day holidays.
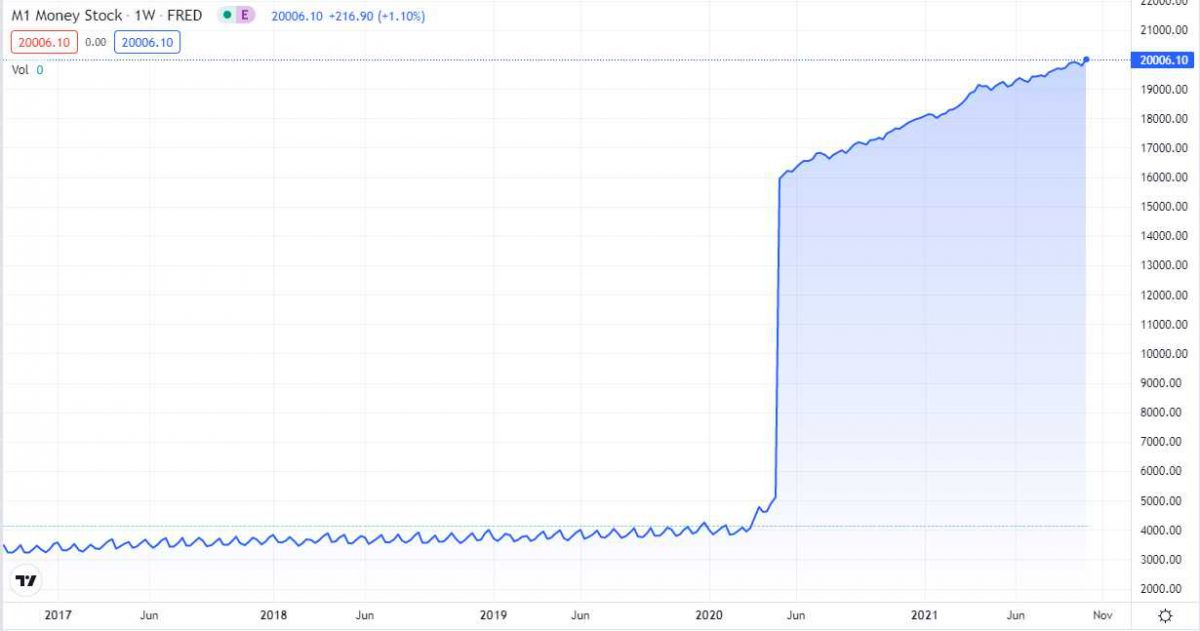
When there's very little trading, there is a larger percentage of computer trading as a certain amount of money flows into ETFs every day from payrolls and retirement accounts, which all run on algorithms. And, of course, if money is coming in and people aren't selling, the algos that run other trading platforms interpret that as a strong market and maintain their own positive bias and, more importantly, they never see a sell signal. The Fed has pumped another 10% into the money supply this year, pushing us up $2Tn – $2Tn was HALF of the total money supply in 2019 – that's what they added this year – and they wonder where the inflation is coming from:

Where does this money go? Well mostly to the Banksters but then they get to multiply that money by 10 and play with it as they see fit. Some of those Banksters are JPM and GS and they buy a lot of stock with it and they lend money (margin, etc) to their clients, who also buy a lot of stocks – and every other asset on the planet that isn't nailed down. All these rich people buying all these assets with all this money MIGHT cause inflation – but the Fed doesn't see it…
If you think about it, a system like that is ripe for manipulation and that's why you see the Banksters talking up the markets whenever there is bad economic news. All they have to do is stop people from selling and the market bias is to go higher. As long as the volume stays low, the indexes keep climbing. This is all well and good UNLESS sentiment changes and people try to sell – there aren't enough natural buyers so the sellers will find no one to sell to and prices can plunge very rapidly. We've seen it before twice in the last twenty years – yet no one seems to think it can happen again.
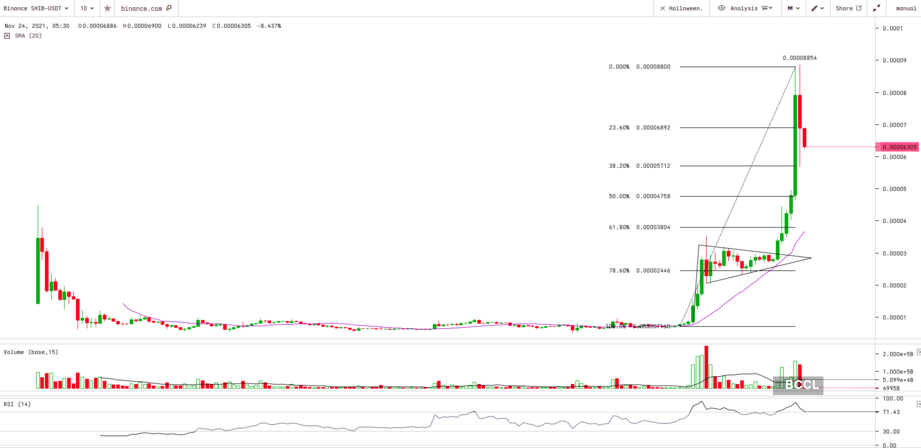
Until that sentiment does change, however, the market can continue to go higher because people can't do math. For example, I'm sure we all have friends who have told us how great their Shiba Inu investment is going and yes, everyone who bought them early made a lot of money but people who are holding them thinking they are going to be worth $1 one day simply don't understand what they are trading. There are 1 QUADRILLION Shiba Inu coins, that is 1,000 Trillion which is, I think, 500M TIMES more Shiba Inu than BitCoin (21M). Even if Shiba Inu were as popular as BitCoin and had the same market cap, $60,000/500M is only 0.00012. Currently, Shiba Inus is trading at 0.000056 – 4 times more projected capitalization than BitCoin.

Very simply, people who are now buying Shiba Inu are idiots but that's OK because we seem to have an endless supply of idiots and those idiots also buy stock – and also don't understand the math of the stocks they are buying. Most of them probably don't even do the math – they just look at the pretty pictures (charts) for signs of where the stock is going and there is no top – there is no maximum value. A stock with a "strong chart" that has been going up should keep going up because it doesn't matter if the price it goes up to reflects $1Tn or $2Tn or $3Tn – what does it matter what you pay for a company if the chart is pretty?
Oddly enough, in all the decades I've been involved in buying and selling businesses – not one small business deal has ever closed because they had a strong chart. There are no charts in real companies – only in the public world (or those who aspire) are we ruled by pictures instead of numbers. If Tom's Deli makes $1,000 on opening week and $2,000 a week later and $3,000 a week after that, do I project that, by the end of the year they will make $52,000 a week? No, it's not possible due to the number of seats the total potential customers etc. There is a number that things will top out at so, when Tom asks me to value him based on making $104,000 a week next year – I say no – even though the chart clearly shows that's which way we are going.
That's valuation. It uses FACTS to establish VALUE. It takes REALITY into consideration. This market is doing none of those things – and that's why it bothers me.
8:30 Update: Forget my doubts, all is well. 531,000 jobs were added in October and the Unemployment Rate is down to 4.6% and, even better if you are a Capitalist, Hourly Earnings calmed down to 0.4% from 0.6% last month so businesses are getting more workers for not much more money – which means the Billionaires get to keep more for themselves – YAY!!!
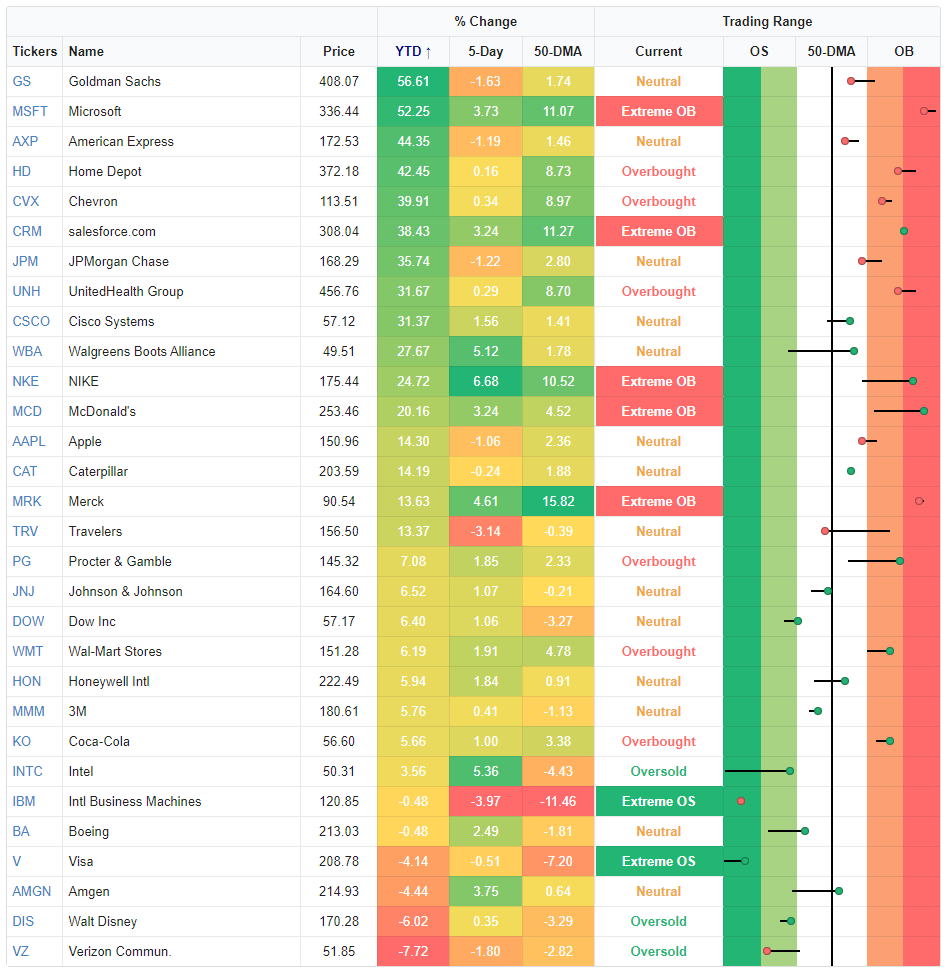
My question is, if things are so great, why is Visa (V) down for the year? They are borrowing at record-low rates and still charging monstrous interest. They didn't lose money last year – they made $10.8Bn and they are making close to $13Bn this year and project $15Bn next year yet the price of the stock is slipping. VZ is in the Dow's dog house too, along with DIS – who at least I can understand as parks and movies have not really come back yet.
Overall, the Dow chart is worth contemplating as we line up investments for next year:

See, there's always something to buy!
Have a great weekend,
– Phil


